World indices overview: news from US 30, US 500, US Tech, JP 225, and DE 40 for 14 January 2025
Global indices are mainly declining following the release of US labour market data. Find out more in our analysis and forecast for 14 January 2025.
US indices forecast: US 30, US 500, US Tech
- Recent data: US nonfarm payrolls came in at 256 thousand in December 2024
- Market impact: the current indicator causes concerns that the Federal Reserve will have to keep high rates longer than expected, putting strong pressure on the stock market
Fundamental analysis
US nonfarm payrolls came in at 256 thousand, above expectations of 164 thousand, indicating stronger-than-expected job growth. This development signals a stable labour market and continued economic expansion. The previous reading was also revised upwards to 212 thousand, strengthening the positive signal.
The unemployment rate was 4.1%, against expectations of 4.2% and the previous reading of 4.2%. A lower unemployment rate indicates an improvement in the labour market sector. If this trend continues to strengthen, inflation expectations may increase, raising doubts that the Federal Reserve is prepared to keep interest rates higher. All the above factors negatively impact the stock market.
US 30 technical analysis
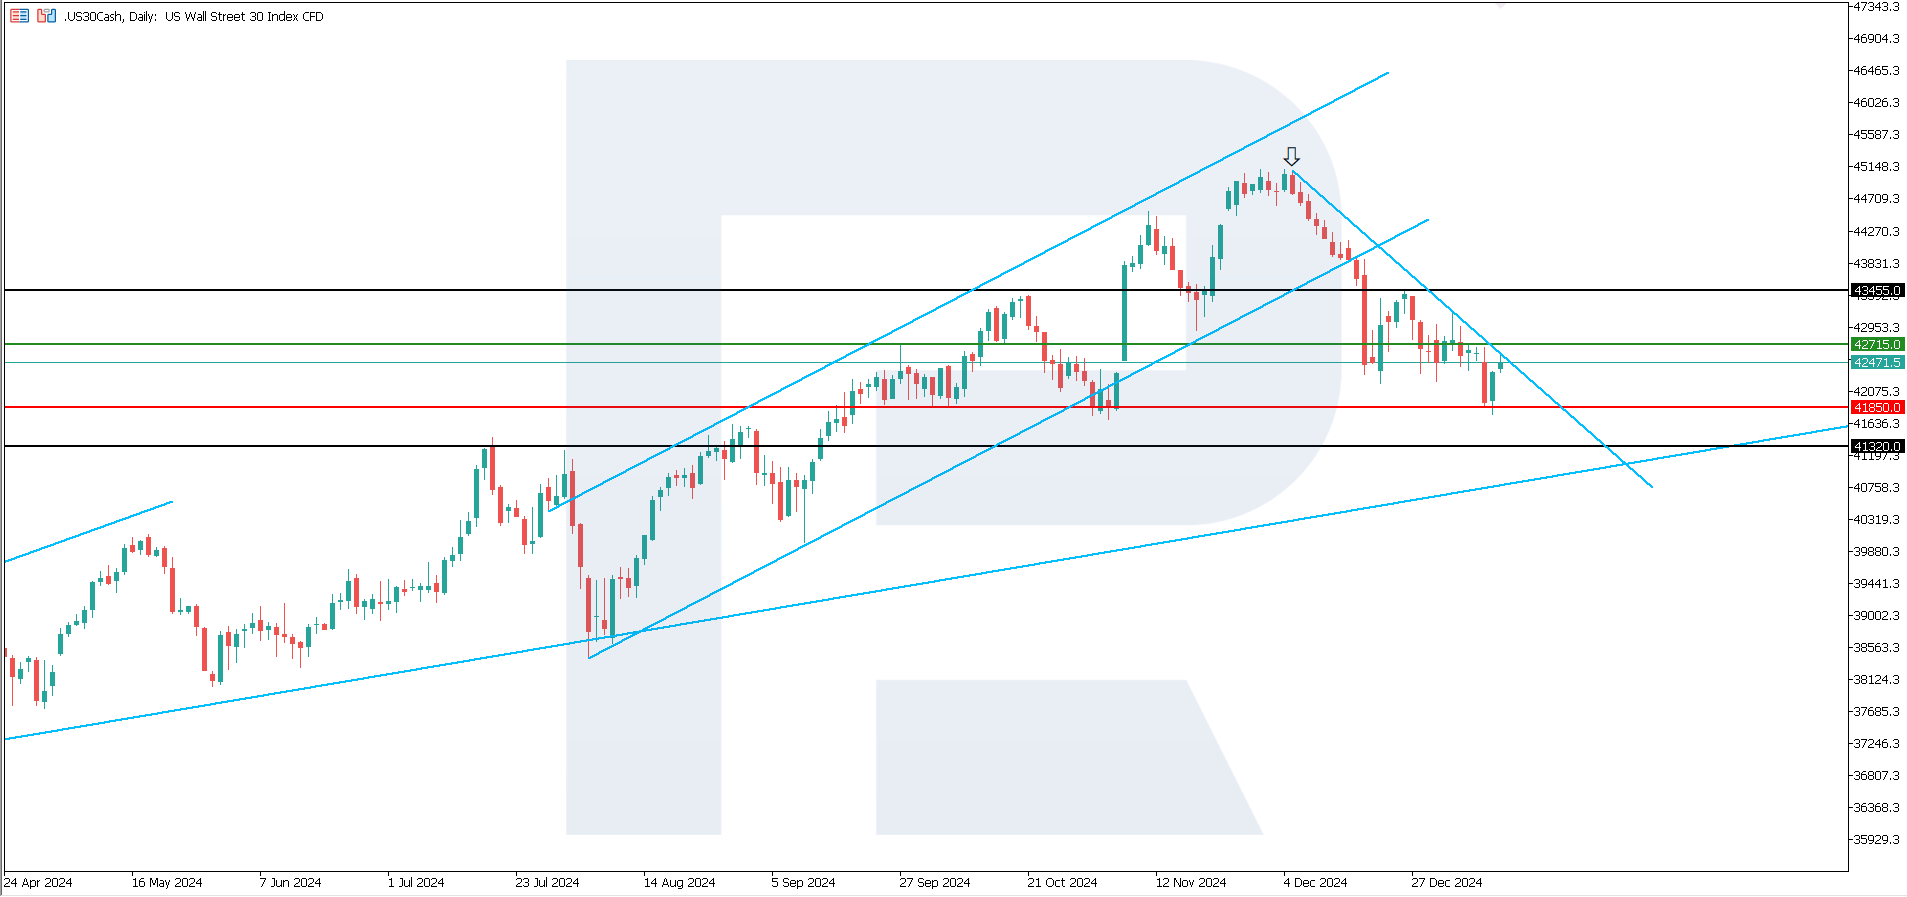
The US 30 stock index decreased by 7.45% from its all-time high, and the downtrend continues. Bears dominate the market despite the bulls’ attempts to reverse the price. According to the US 30 technical analysis, the decline is medium-lived.
The following scenarios are considered for the US 30 price forecast:
- Pessimistic US 30 forecast: a breakout below the 41,850.0 support level could push the index down to 41,320.0
- Optimistic US 30 forecast: a breakout above the 42,715.0 resistance level could drive the price up to 43,455.0
US 500 technical analysis
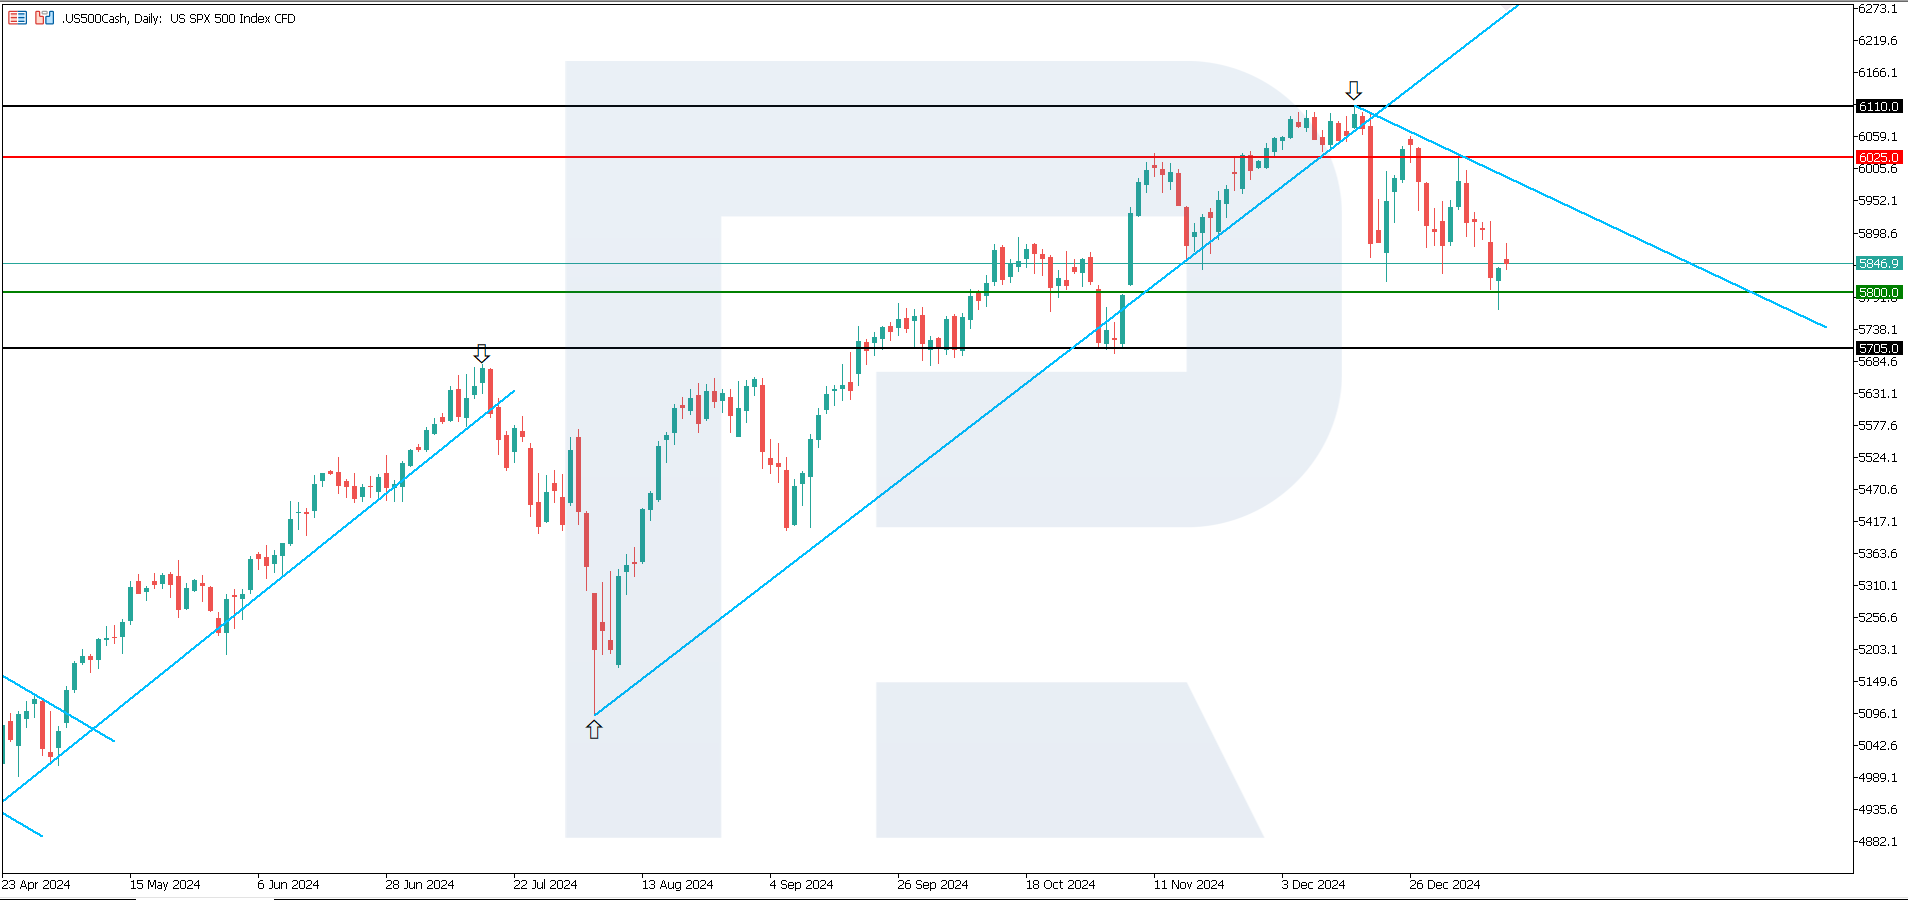
The US 500 stock index has plunged over 5.5% from its all-time high. The downtrend started in mid-December last year and has lasted for a month. According to the US 500 technical analysis, it will continue until new US economic data is released.
The following scenarios are considered for the US 500 price forecast:
- Pessimistic US 500 forecast: a breakout below the 5,800.0 support level could send the index down to 5,705.0
- Optimistic US 500 forecast: a breakout above the 6,025.0 resistance level could propel the index to 6,110.0
US Tech technical analysis
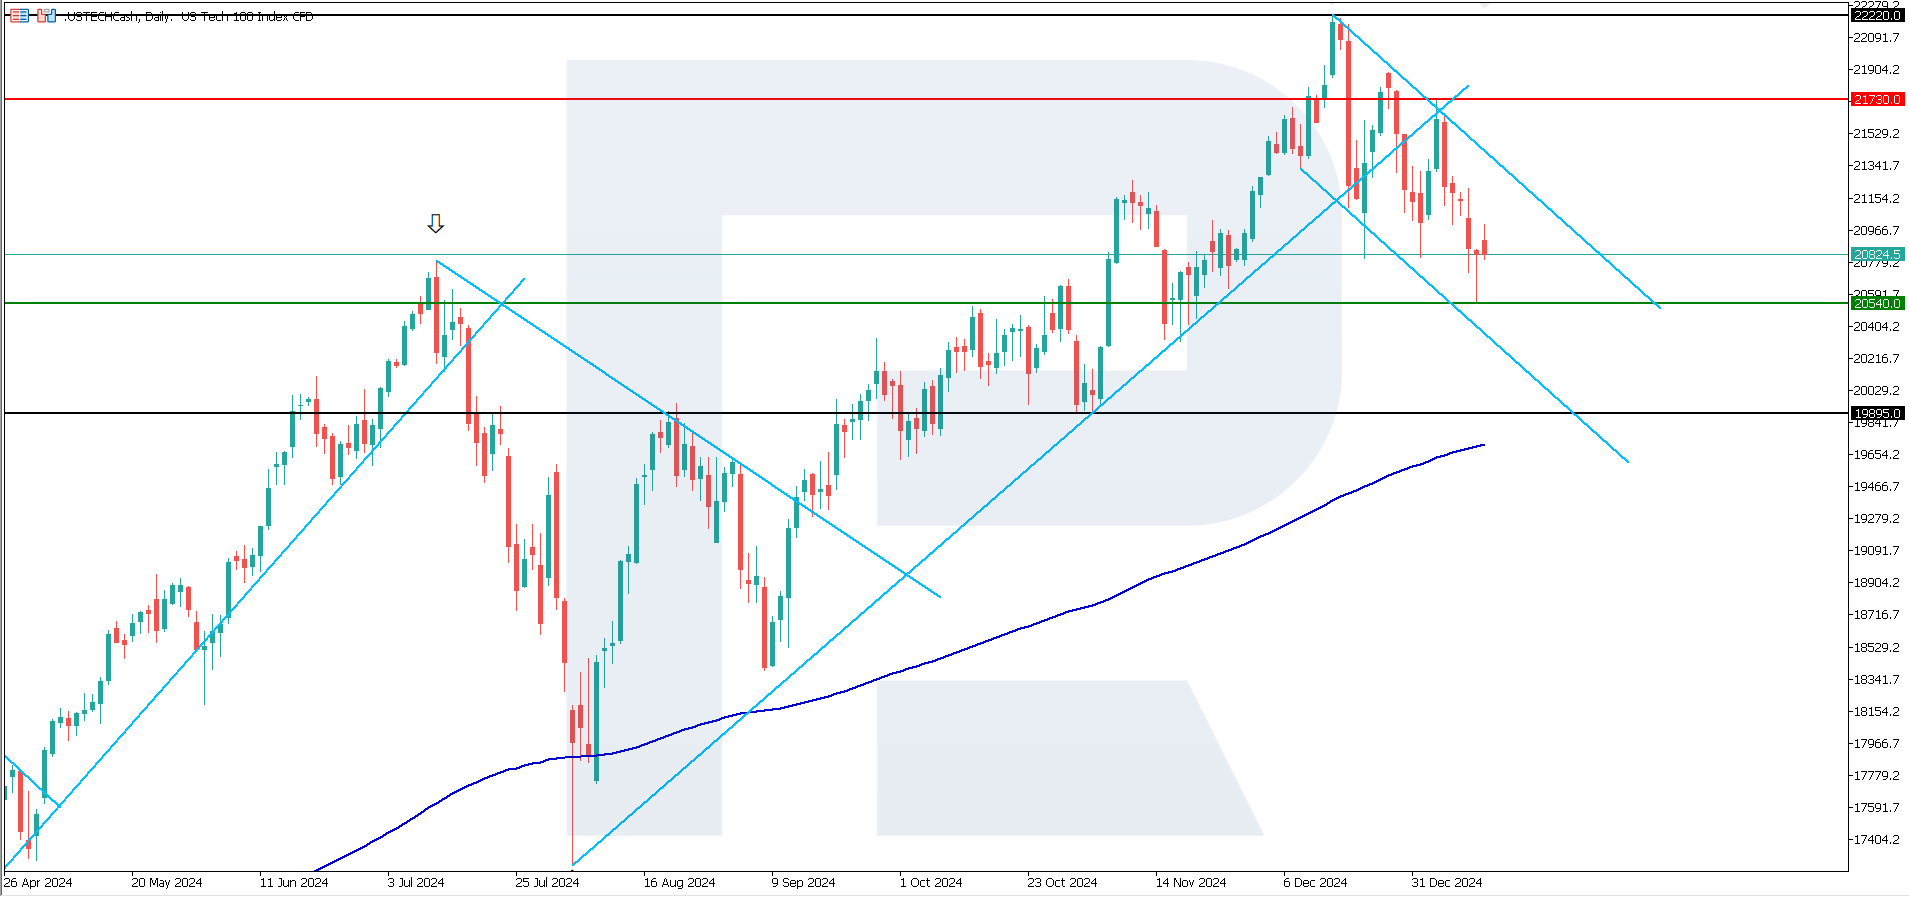
The US Tech stock index continues to edge down, and the downtrend becoming medium-lived. According to the US Tech technical analysis, any growth may only be considered a short-term correction.
The following scenarios are considered for the US Tech price forecast:
- Pessimistic US Tech forecast: a breakout below the 21,540.0 support level could push the index down to 19,895.0
- Optimistic US Tech forecast: a breakout above the 21,730.0 resistance level could drive the index up to 22,220.0
Asia index forecast: JP 225
- Recent data: Japan’s 40-year government bond yield rose by three basis points to 2.755%
- Market impact: if the yield continues to rise and the Bank of Japan tightens monetary policy further, the Japanese stock market may face short-term volatility
Fundamental analysis
Japan’s 40-year government bond yield reached the highest level since its issuance in 2007 amid a global sell-off of government bonds and expectations that the Bank of Japan will raise interest rates in the coming months.
The yield increased by three basis points to 2.755%, the highest level since 2007, when the bonds were first issued. Japan’s 20-year government bond yield also hit its peak since May 2011. A stock decline due to rising bond yields could lead to capital outflow from the stock market into the debt market.
JP 225 technical analysis
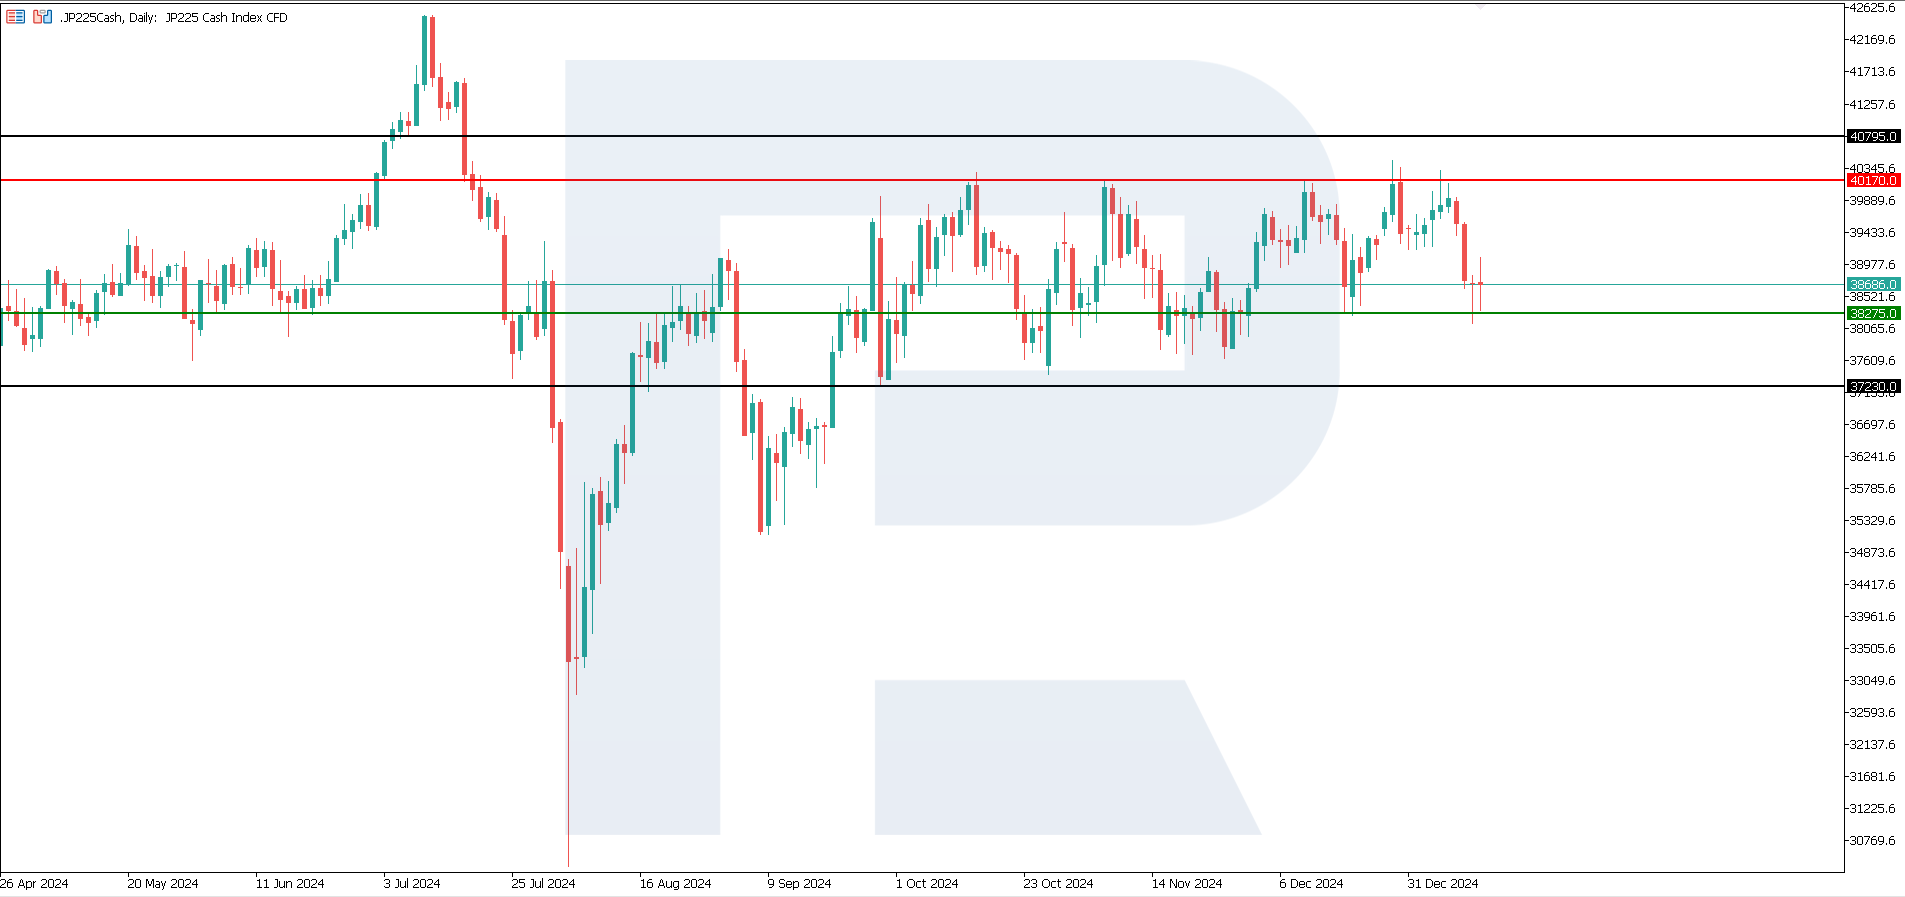
The JP 225 stock index continues to trade within a sideways channel without a clear trend. The quotes have approached the lower boundary of the channel at 38,875.0. According to the JP 225 technical analysis, there are no prerequisites for forming a trend. Any directional price movement will most likely be short-lived.
The following scenarios are considered for the JP 225 price forecast:
- Pessimistic JP 225 forecast: a breakout below the 38,275.0 support level could drive the index down to 37,230.0
- Optimistic JP 225 forecast: a breakout above the 40,170.0 resistance level could push the index to 40,795.0
European index forecast: DE 40
- Recent data: bankruptcies are expected to increase by 25-30% in 2024
- Market impact: rising bankruptcies in Germany pose risks for some sectors and the DE 40 index in general. However, the mitigating effect of the ECB policy and low rates may support the overall appeal of stocks
Fundamental analysis
According to experts, the weakness of the German economy in 2025 will lead to a significant increase in corporate bankruptcies. As Handelsblatt reports, restructuring specialists expect bankruptcies to increase by 25-30% this year, reaching a level comparable to the last financial crisis in 2009.
Rising bankruptcies in Germany pose risks for some sectors and the index in general. However, the mitigating effect of the ECB policy and low rates may bolster the overall appeal of stocks. The market will likely become more segmented, focusing on companies with strong financial performance and resilient business models.
DE 40 technical analysis
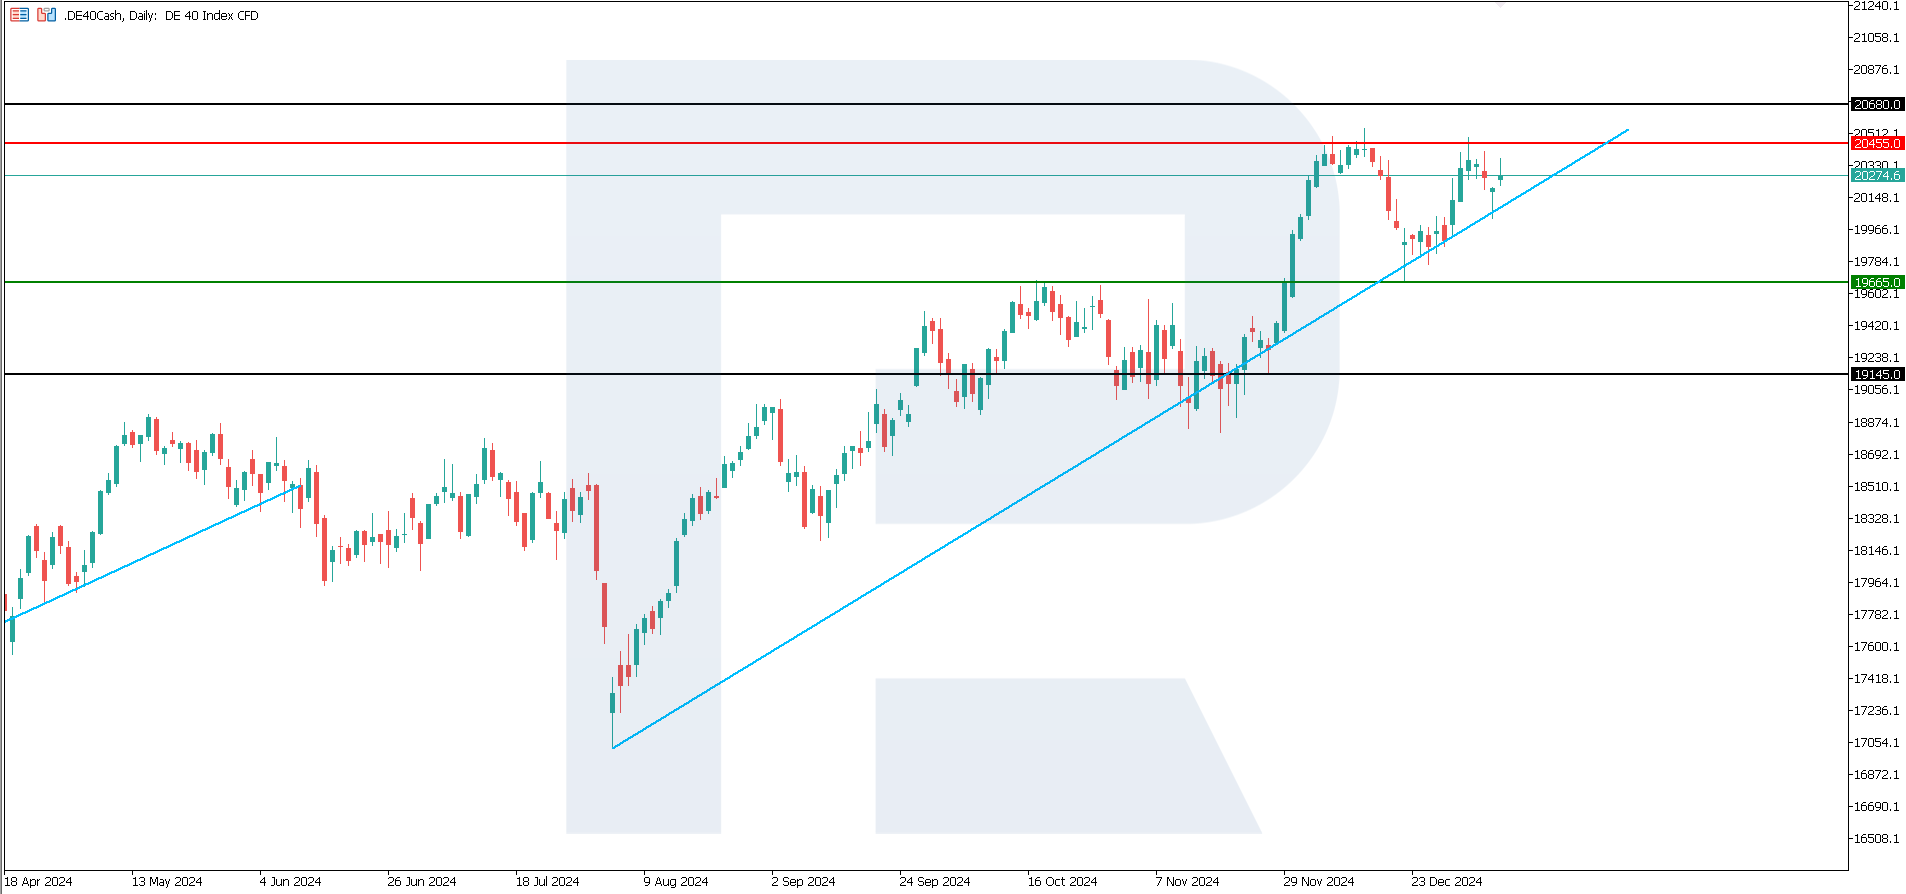
The DE 40 stock index maintains a weak uptrend. However, it remains 1.1% lower than its all-time high. According to the DE 40 technical analysis, the growth potential persists. Nevertheless, the uptrend will unlikely be medium-lived.
The following scenarios are considered for the DE 40 price forecast:
- Pessimistic DE 40 forecast: a breakout below the 19,665.0 support level could send the index down to 19,145.0
- Optimistic DE 40 forecast: if the price breaks above the 20,455.0 resistance level, it could climb to 20,680.0
Summary
Following the release of US labour market data, the stock indices continued to decline. The forecast for the US 30, US 500, and US Tech indices is moderately negative. The JP 225 index will likely continue to trade within a sideways channel. The uptrend remains only in the DE 40 index. The US inflation data, which may impact investor sentiment in other markets, will be crucial.
Forecasts presented in this section only reflect the author’s private opinion and should not be considered as guidance for trading. RoboForex bears no responsibility for trading results based on trading recommendations described in these analytical reviews.

