US 500 analysis: the uptrend ended, and the correction began
The US 500 stock index has declined for three consecutive trading sessions, breaking through all the support levels. It is now difficult to determine whether this is the beginning of a global downtrend or just a correction.
US 500 trading key points
- Recent data: US initial jobless claims reached 243,000
- Economic indicators: a weakening employment market allows the US Federal Reserve to lower interest rates more than once this year
- Market impact: a rate reduction leads to falling demand for the national debt and rising demand for stocks
- Resistance: 5,680.0, Support: 5,585.0
- US 500 price target: 5,390.0
Fundamental analysis
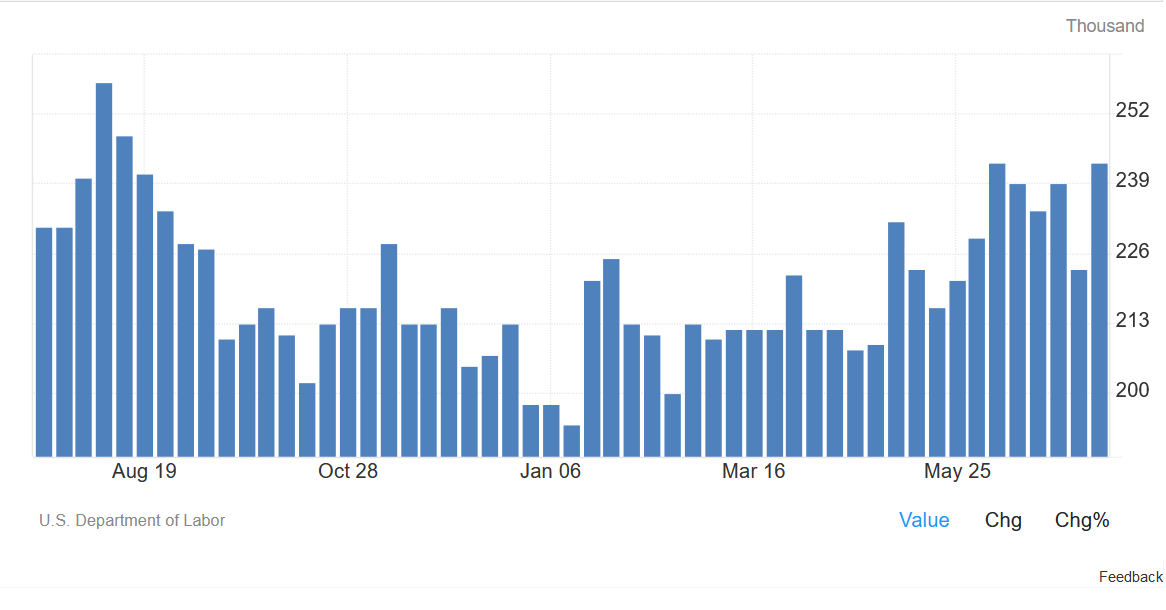
Last Thursday, the US Department of Labor reported that initial jobless claims rose by 21,000 to 243,000 over the previous week, while analysts expected 230,000. Their total number increased by 20,000 to 1.867 million. The employment market is still experiencing a protracted decline.
Source: https://tradingeconomics.com/united-states/jobless-claims
This situation gives the Federal Reserve every reason to lower interest rates twice this year. However, this decision is obvious and could have already been factored into prices. Due to this, some experts expect not a rise but a massive decline in the US 500 index.
In an interview with The Wall Street Journal, Mark Spitznagel, the founder and chief investment officer of the hedge fund Universa Investments, said that the US stock market is moving towards a significant sell-off, which will be caused by a burst of “the greatest bubble in human history”.
US 500 technical analysis
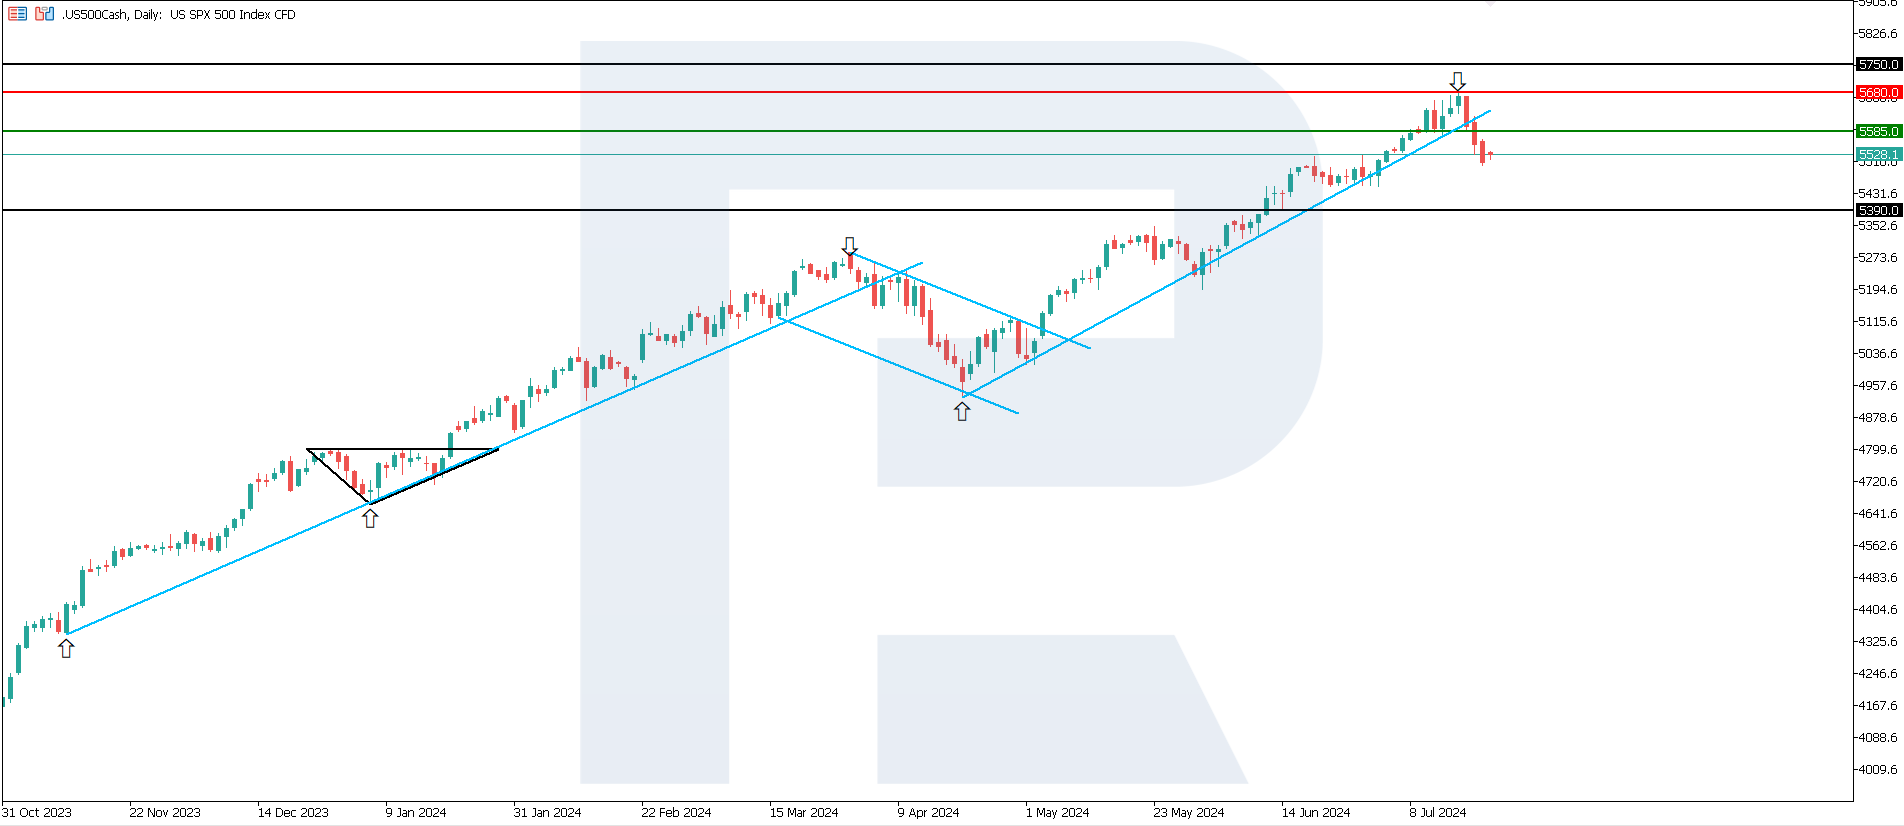
The stock index embarked on a downtrend after breaking below the 5,585.0 support level. It is unclear whether it will be a long-term or short-term trend followed by growth, with the price reaching a new all-time high. The fact remains that bears are exerting quite intense pressure on the market.
Key US 500 levels to watch this week:
- Resistance level: 5,680.0 – if the price breaks above this level, it could target a new all-time high of 5,700.0
- Support level: 5,585.0 – this support level has been breached as part of the emerging downtrend with a target at 5,390.0
Summary
Although the US 500 index trend has reversed to a downtrend, it is too early to believe it will last long. From the fundamental analysis perspective, there is every reason to resume growth. However, there is a high probability that the market has already recouped a Federal Reserve interest rate cut, and profits are just being locked in now. The nearest decline target for the US 500 index is 5,390.0.
Forecasts presented in this section only reflect the author’s private opinion and should not be considered as guidance for trading. RoboForex bears no responsibility for trading results based on trading recommendations described in these analytical reviews.


