US 500 analysis: the downtrend persists
The US 500 stock index has formed a support level, but the trend remains downward. Given the weakening US employment market, the US 500 index forecast is negative.
US 500 trading key points
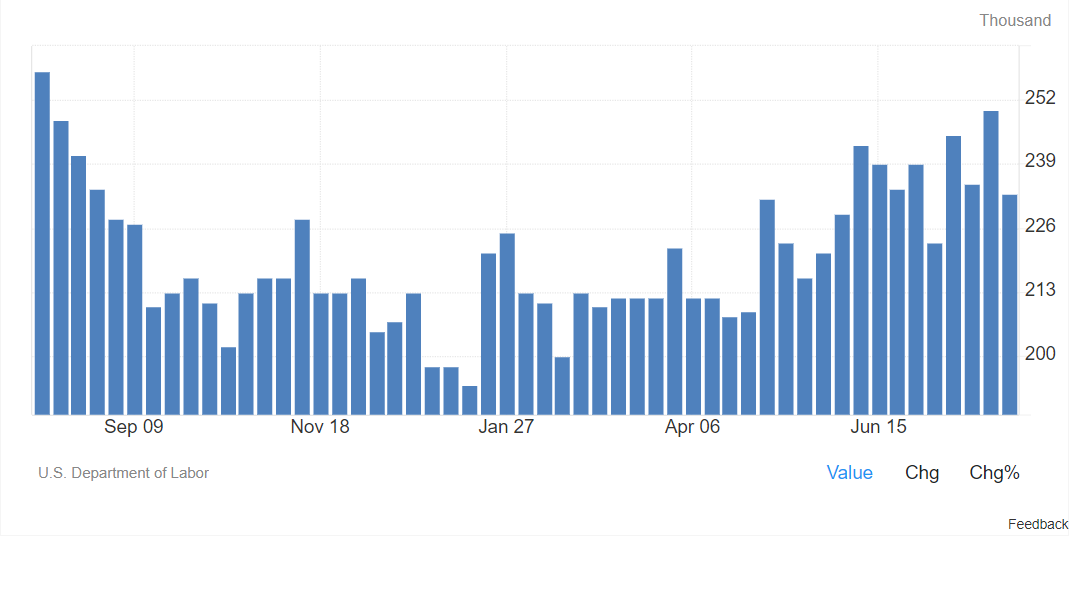
- Recent data: initial jobless claims reached 233,000
- Economic indicators: the US Federal Reserve is guided by employment market indicators in its decisions regarding the key rate
- Market impact: any weakening of the employment market increasingly reduces the arguments for maintaining the interest rate at the current level
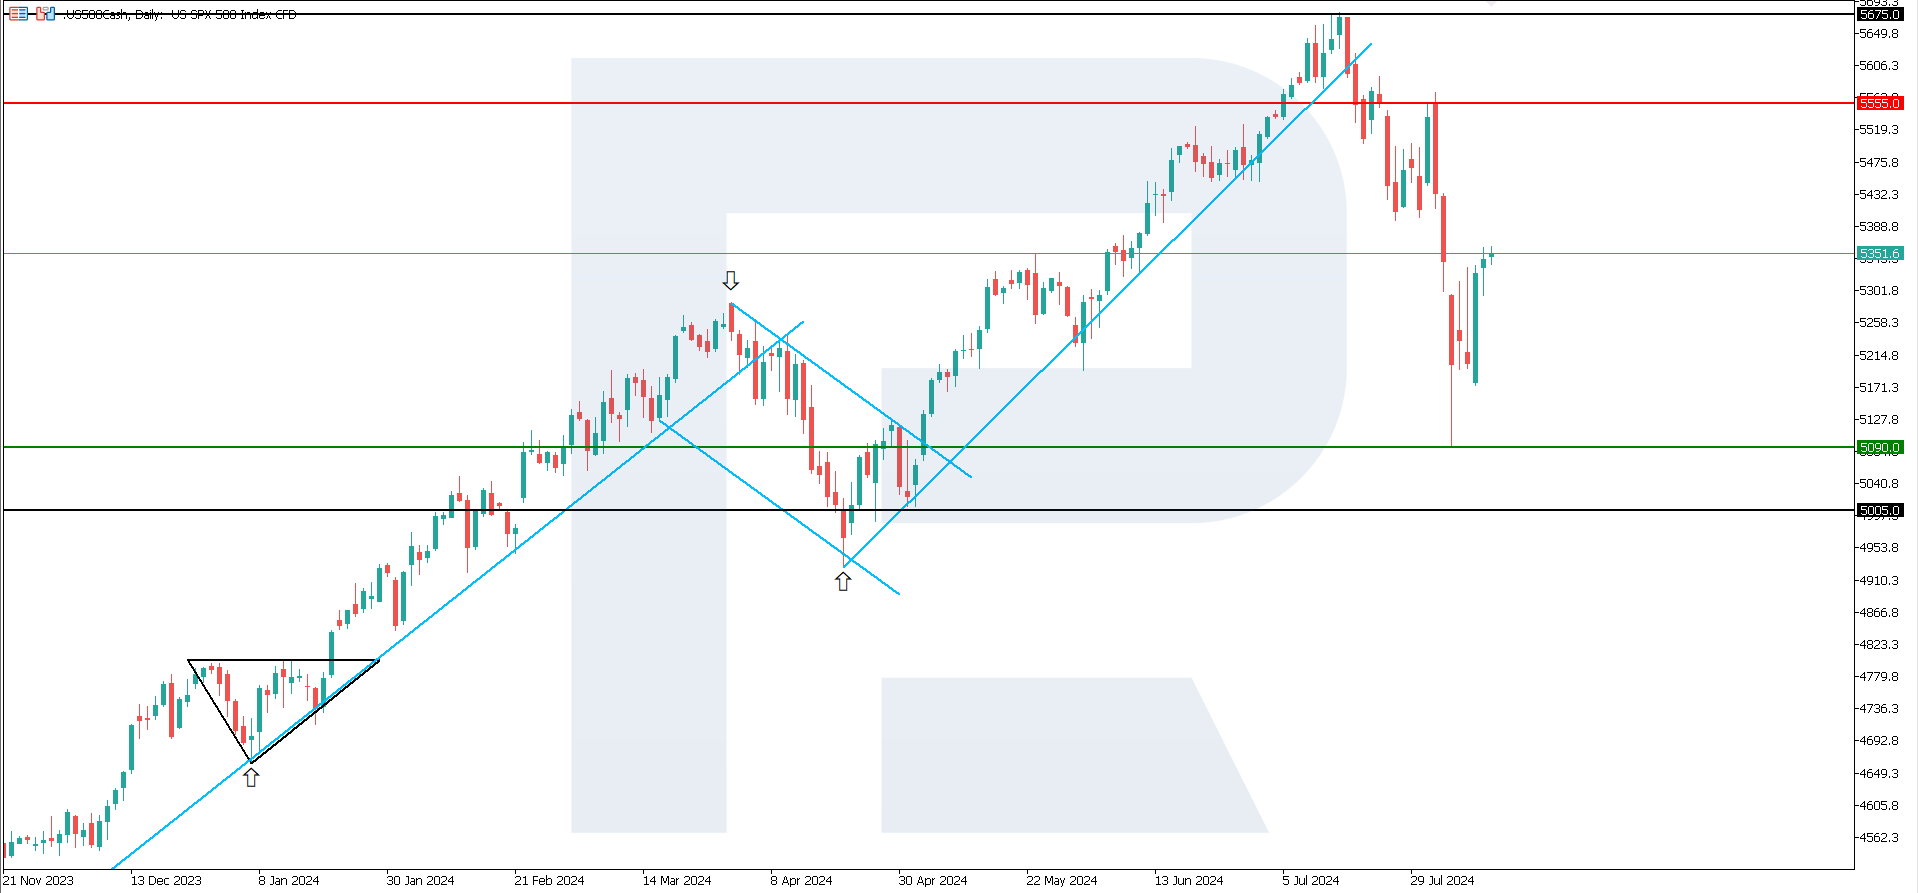
- Resistance: 5,555.0, Support: 5,090.0
- US 500 price forecast: 5,005.0
Fundamental analysis
The US Department of Labor data showed that initial jobless claims decreased by 16,000 to 233,000 last week. Analysts had expected the number of claims to be 240,000. However, total claims increased by 6,000 to 1.88 million, marking the highest level since November 2021.
Source: https://tradingeconomics.com/united-states/jobless-claims
In addition to the weak US employment market, small and medium-sized businesses also suffer from elevated interest rates. The number of US Chapter 11 bankruptcies increased to 2,462, marking the highest figure in the past 13 years, driven by rising borrowing costs due to the elevated key rate.
Inflation data is due for release this week. If it is lower than expected, the issue of a September interest rate cut may be deemed resolved. Investors will likely start buying US government bonds again, which could put the stock market under pressure. For this reason, the US 500 forecast for next week is negative.
US 500 technical analysis
The US 500 stock index is in a strong downtrend. The recent growth in trading sessions is just a correction with no indication of a trend reversal. The price will likely continue to decline and break below the current support level at 5,090.0, targeting 5,005.0.
Key levels for the US 500 analysis:
- Resistance level: 5,555.0 – a breakout above this level could drive the price up to 5,675.0
- Support level: 5,090.0 – a breakout below the support level might push the index down to 5,005.0
Summary
The US 500 stock index is in a downtrend after the weak US employment market data published last week. Inflation data is expected this week, which could strengthen the US Federal Reserve’s resolve to lower interest rates as early as September. This could boost demand for government debt, leading to a negative US 500 price forecast.
Forecasts presented in this section only reflect the author’s private opinion and should not be considered as guidance for trading. RoboForex bears no responsibility for trading results based on trading recommendations described in these analytical reviews.


