US 30 analysis: key players await employment market statistics to determine the future trend
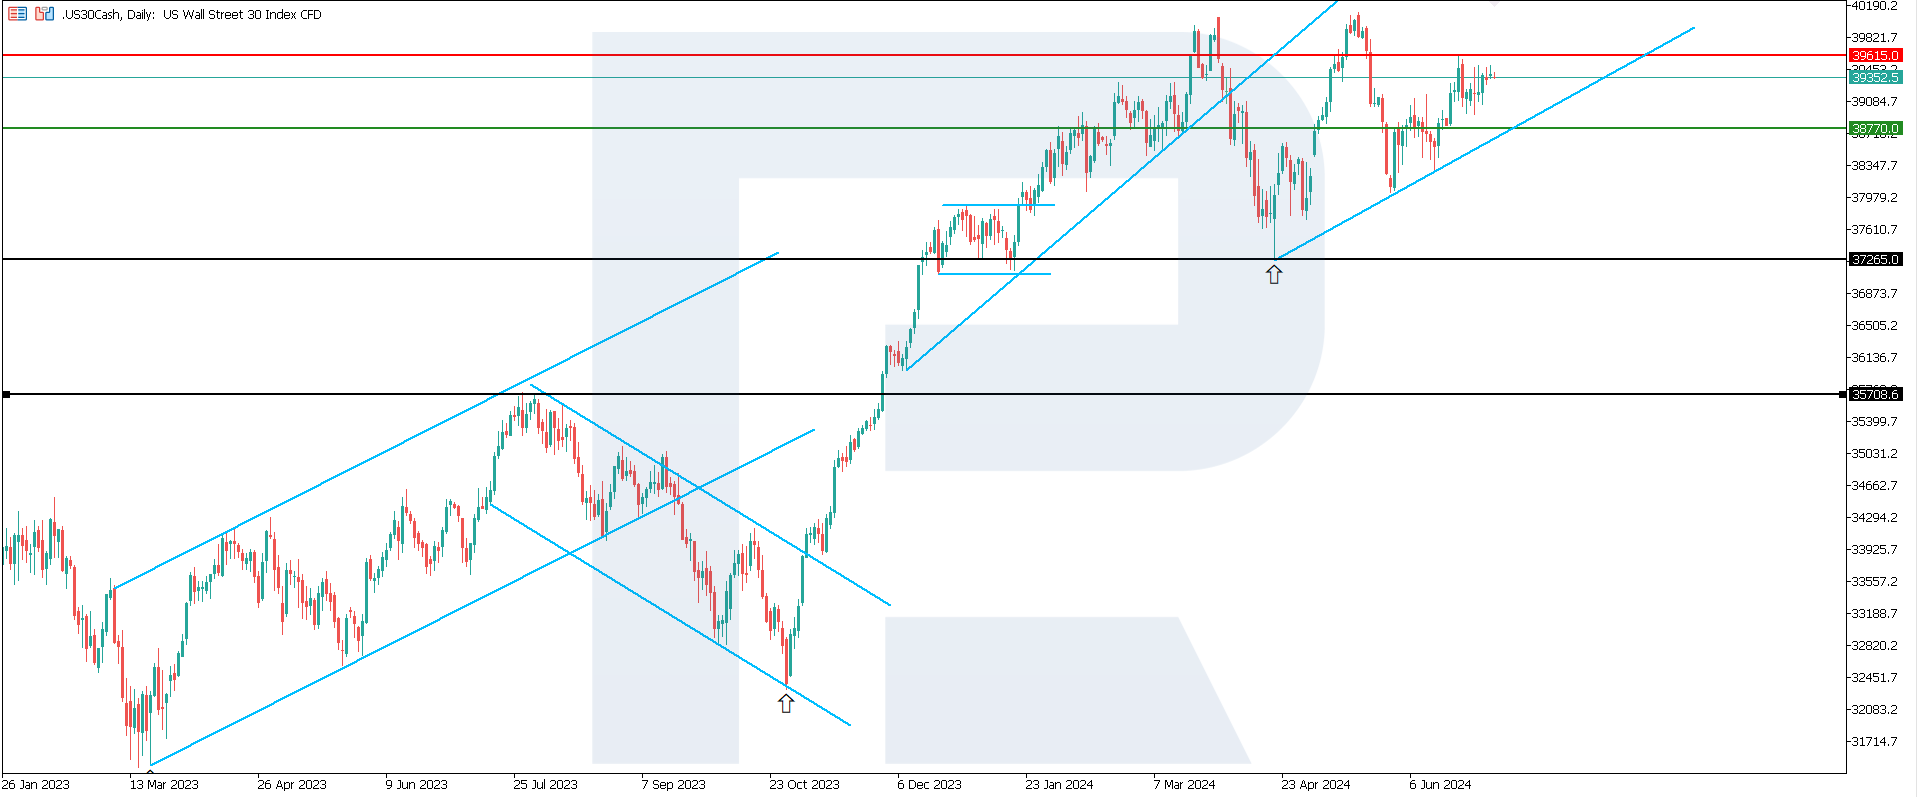
The US 30 stock index is trading with relatively low volatility amid expectations for employment market statistics. Although the quotes are in an uptrend, growth potential is limited: the support and resistance levels remained unchanged since last Friday.
US 30 trading key points
- Recent data: continuing jobless claims increased to 1.86 million in the week ending 22 June 2024
- Economic indicators: this is the highest reading since November 2021, according to the US Department of Labor data released on Wednesday
- Market impact: apart from core PCE inflation, the US Federal Reserve also focuses on the employment market. The regulator postponed an interest rate cut largely due to the reduction in the unemployment rate and slowly reducing inflation
- Resistance: 39,615.0, Support: 38,770.0
- US 30 price target: 40,800.0
Fundamental analysis
US jobless claims increased for the ninth consecutive week, marking the longest period since 2018. This indicates that an increasing number of people are having difficulty finding new jobs.
Continuing jobless claims increased to 1.86 million in the week ending 22 June 2024, representing the highest reading since November 2021, according to the US Department of Labor data released on Wednesday. Initial jobless claims rose by 4,000 last week, reaching 238,000.
It can be concluded that if unemployment does not increase, it is highly unlikely to decrease. Together with a fall in inflation, this can be an argument for the US Federal Reserve to start lowering interest rates earlier than September.
US 30 technical analysis
The US 30 stock index is in an uptrend on the daily chart. However, the quotes have been hovering between the resistance and support levels for a week without showing a clear tendency to break any of them. A sideways channel could form. Employment market data will determine the US 30 trends for the upcoming week. Key levels to watch include:
- Resistance level: 39,615.0 – a breakout above this level will open the potential for growth to 40,800.0
- Support level: 38,770.0 – a breakout below this level may push the index down to 37,265.0
Summary
The US employment market is showing weakness. If indirect signs confirm that an increasing number of people are having difficulties finding new jobs, the Federal Reserve will have fewer reasons to keep the interest rate at the current level. The US 30 stock index is in an uptrend on the daily timeframe. If the 39,615.0 resistance level breaks, the index will rise to 40,800.0. However, the probability of forming a sideways channel cannot be ruled out.
Forecasts presented in this section only reflect the author’s private opinion and should not be considered as guidance for trading. RoboForex bears no responsibility for trading results based on trading recommendations described in these analytical reviews.


