EURUSD, USDJPY, GBPUSD, AUDUSD, USDCAD, XAUUSD, and Brent technical analysis and forecast for 21 March 2025
Here is a detailed daily technical analysis and forecast for EURUSD, USDJPY, GBPUSD, AUDUSD, USDCAD, XAUUSD, and Brent for 21 March 2025.
EURUSD forecast
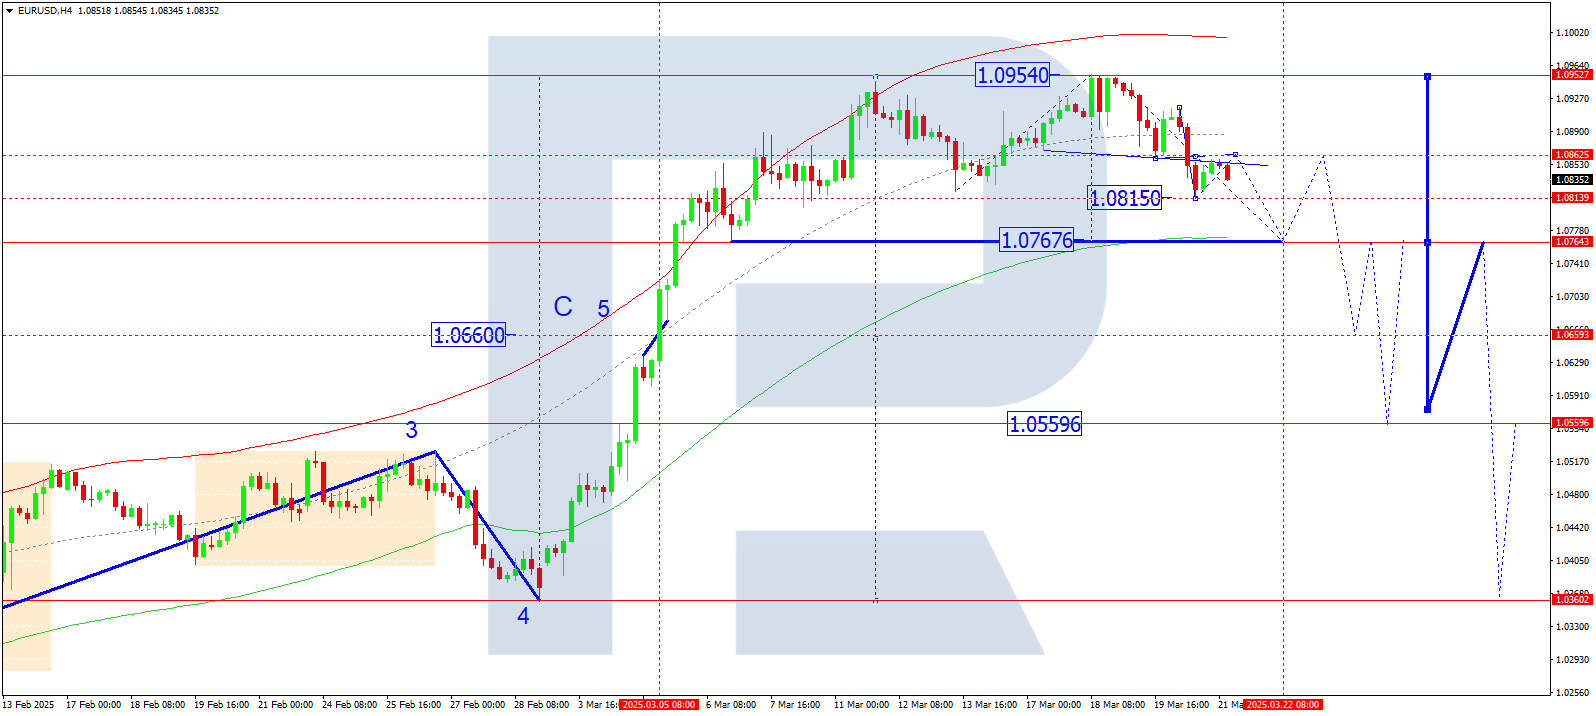
On the H4 chart of EURUSD, the market completed a downward wave structure to 1.0815 and corrected to 1.0858, effectively outlining a new consolidation range around 1.0862. Today, 21 March 2025, we expect the downward wave to continue towards 1.0765. After reaching this level, we will consider the likelihood of a growth wave towards 1.0865.
Technically, this scenario is confirmed by the specified Elliott wave structure and the matrix of the downward wave with a pivot at 1.0865, which is considered key for EURUSD. Today, the market is expected to continue moving towards the lower boundary of the Price Envelope – 1.0765. Afterwards, a growth wave towards its central line – 1.0865 – is possible.
Technical indicators for today’s EURUSD forecast suggest a continued decline towards 1.0767.
USDJPY forecast
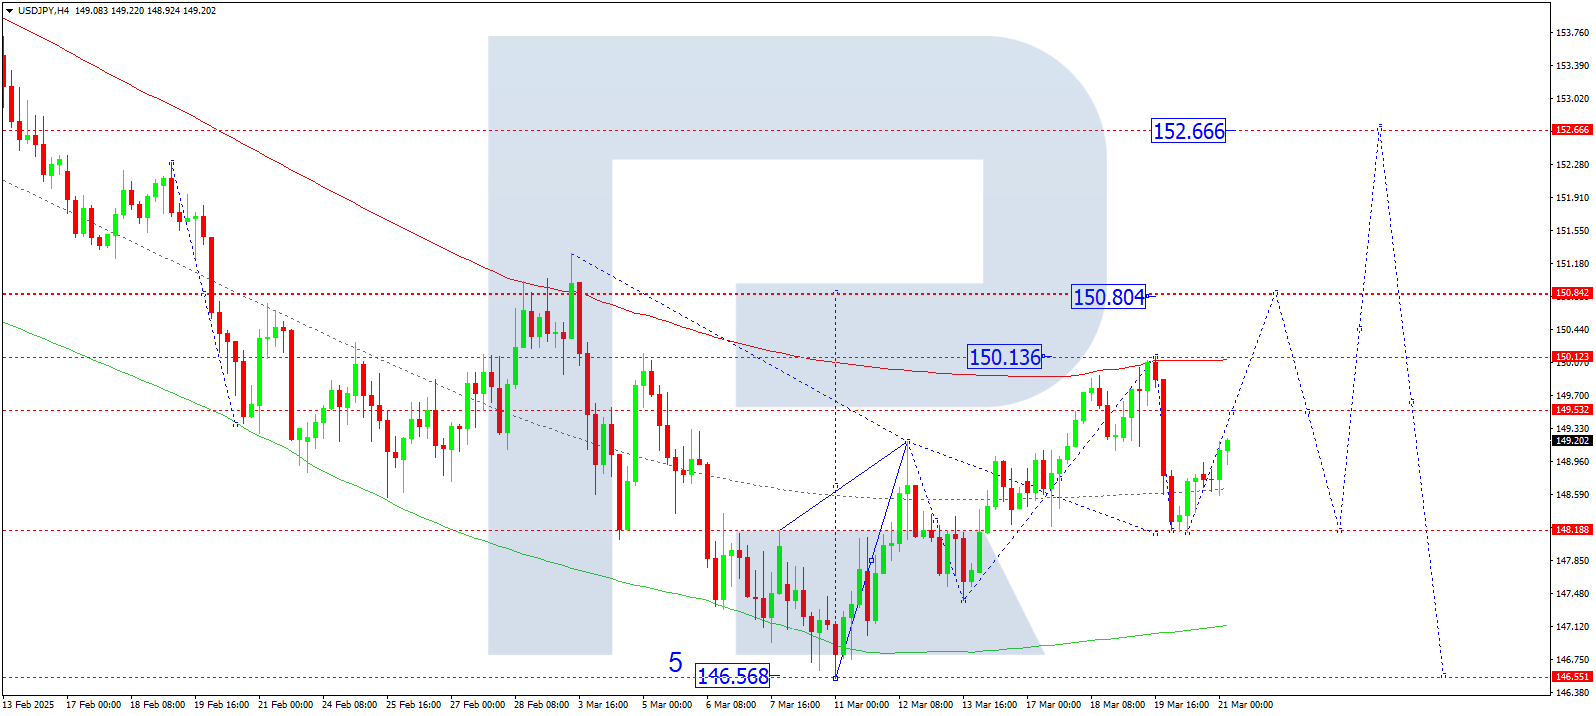
On the H4 chart of USDJPY, the market completed a downward wave to 148.18. Today, 21 March 2025, a growth wave is forming towards 150.80. After this target is reached, we expect the beginning of a downward move to 148.20.
Technically, this scenario is confirmed by the specified Elliott wave structure and the matrix of the upward wave with a pivot at 149.70. The market has completed a correction to the central line of the Price Envelope – 148.18. Today, a further rise towards the upper boundary – 150.80 – is considered likely.
Technical indicators for today’s USDJPY forecast suggest a growth wave towards 150.80.
GBPUSD forecast
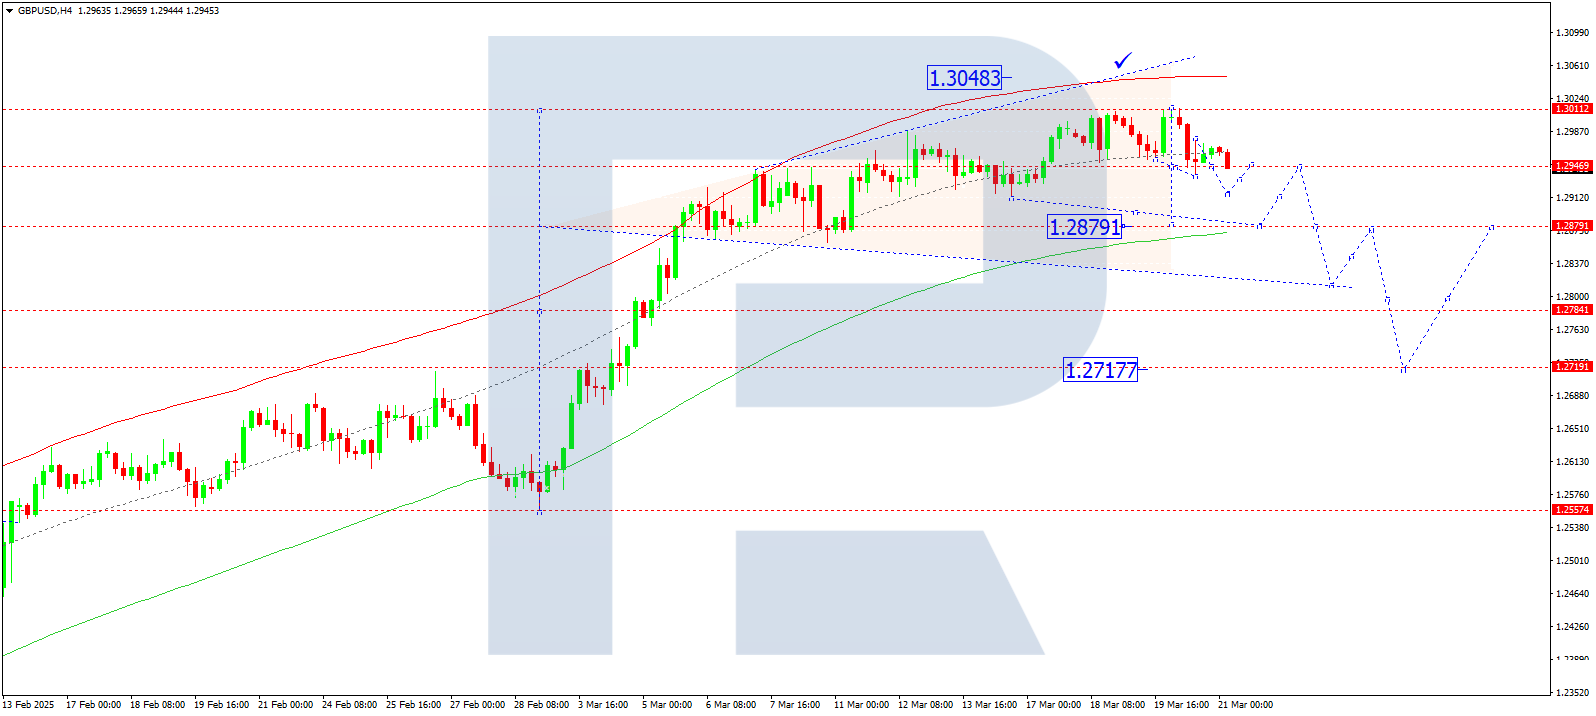
On the H4 chart of GBPUSD, the market continues developing a downward wave towards 1.2879. Today, 21 March 2025, we expect this target level to be reached. A correction towards 1.2950 is possible afterwards, followed by a further decline towards 1.2717.
Technically, this scenario is confirmed by the specified Elliott wave structure and the matrix of the downward wave with a pivot at 1.2950. At the moment, the market continues heading towards the lower boundary of the Price Envelope – 1.2879. Afterwards, a rebound towards the central line – 1.2950 – will become relevant.
Technical indicators for today’s GBPUSD forecast suggest a decline towards 1.2879.
AUDUSD forecast
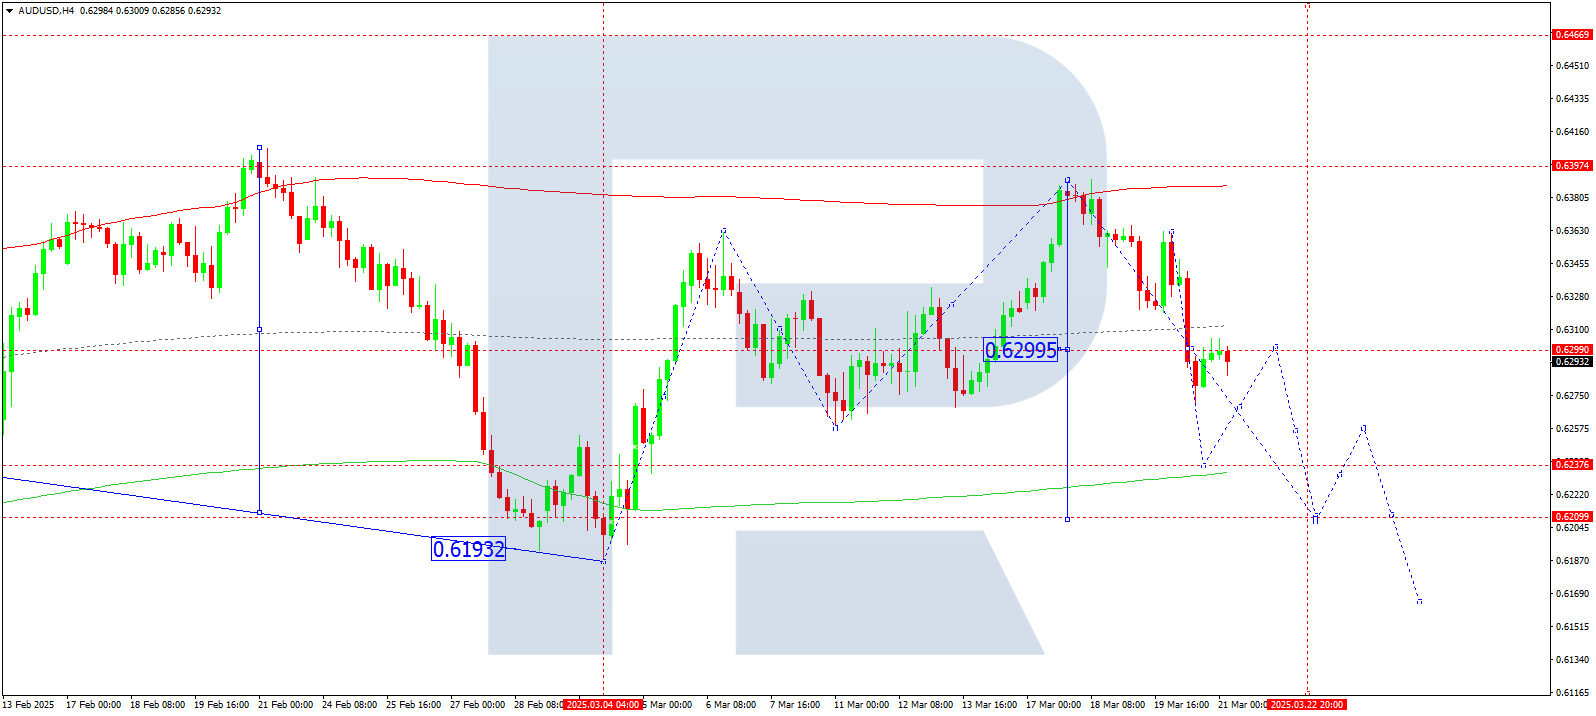
On the H4 chart of AUDUSD, the market continues developing a consolidation range around 0.6300. Today, 21 March 2025, a decline to 0.6237 is expected, with a possible trend continuation towards 0.6200.
Technically, this scenario is confirmed by the specified Elliott wave structure and the matrix of the downward wave for AUDUSD with a pivot at 0.6300. Currently, a downward wave structure is forming towards the lower boundary of the Price Envelope – 0.6200. Afterwards, a correction towards the central line – 0.6300 – is not ruled out.
Technical indicators for today’s AUDUSD forecast suggest continued downward movement towards 0.6237 and 0.6200.
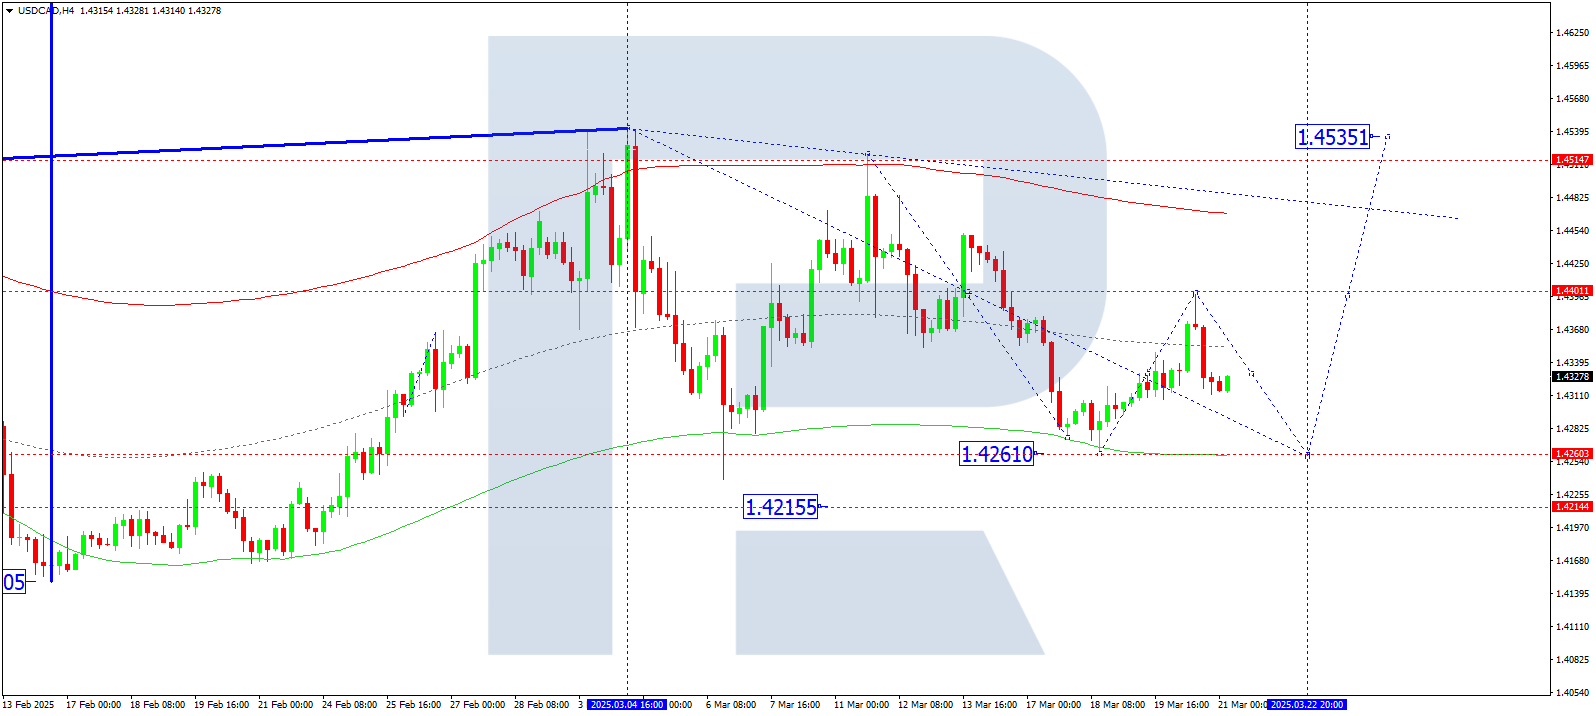
USDCAD forecast
On the H4 chart of USDCAD, the market completed a growth wave to 1.4400 and corrected to 1.4312. Today, 21 March 2025, we expect the upward wave to continue towards 1.4535. If this level is broken, the trend could extend to the local target at 1.4815.
Technically, this scenario is confirmed by the specified Elliott wave structure and the matrix of the upward wave with a pivot at 1.4535, which is considered key for USDCAD. At the moment, the market completed a wave of growth to the central line of the Price Envelope – 1.4400. Today, the expectation is for the wave to stretch towards its upper boundary – 1.4535.
Technical indicators for today’s USDCAD forecast suggest growth towards 1.4535.
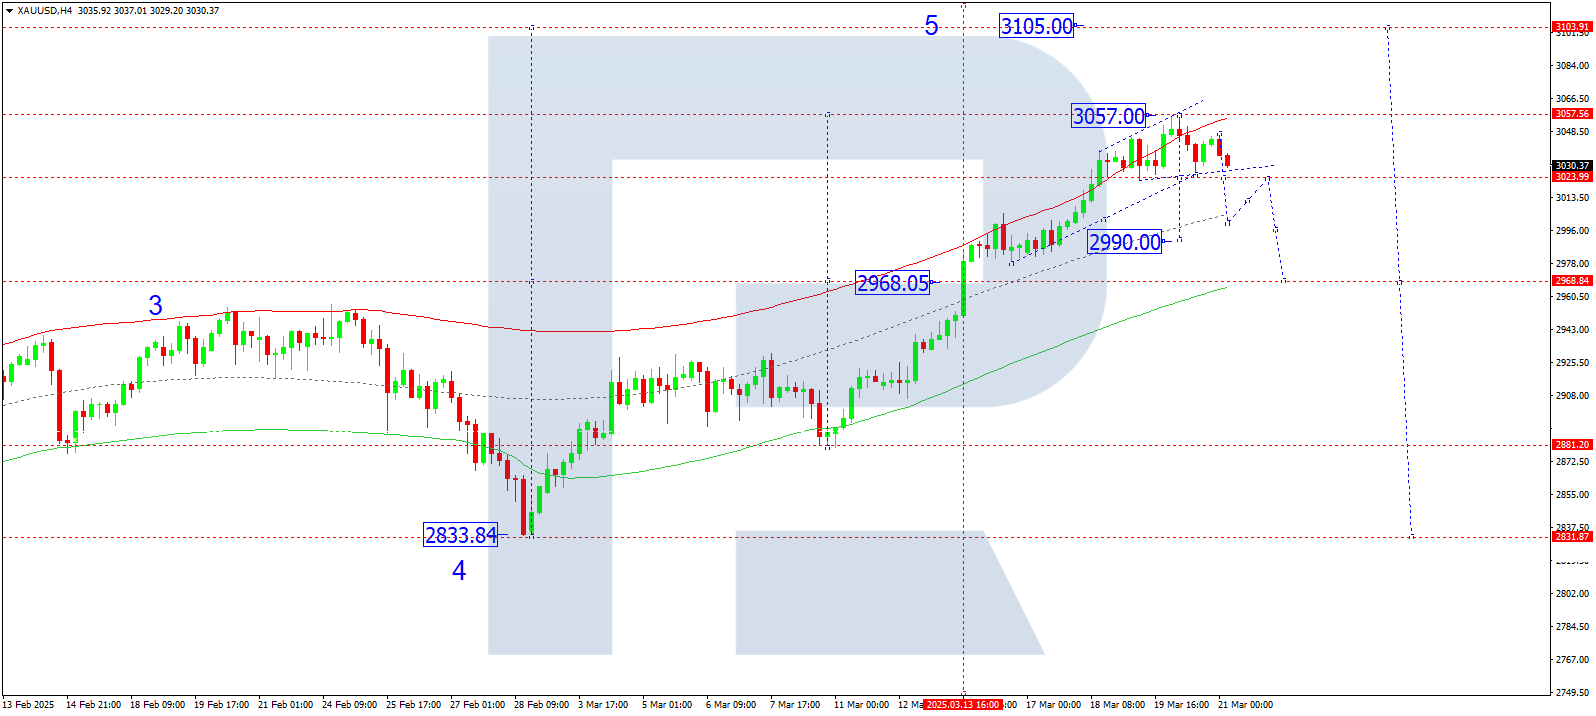
XAUUSD forecast
On the H4 chart of XAUUSD, the market is forming a consolidation range below 3,057. Today, 21 March 2025, we expect a possible downward breakout with a decline towards 2,990. After reaching this level, a rebound to 3,022 is not excluded. Afterwards, a further downward trend towards 2,968 may follow.
Technically, this scenario is confirmed by the specified Elliott wave structure and the matrix of the downward wave with a pivot at 3,022, considered key for XAUUSD. Currently, the market continues its decline towards the central line of the Price Envelope – 2,990. Then a rise to 3,022 is expected, followed by a decline to the lower boundary of the Envelope at 2,968.
Technical indicators for today’s XAUUSD forecast indicate the likelihood of a decline towards 2,990 and 2,968.
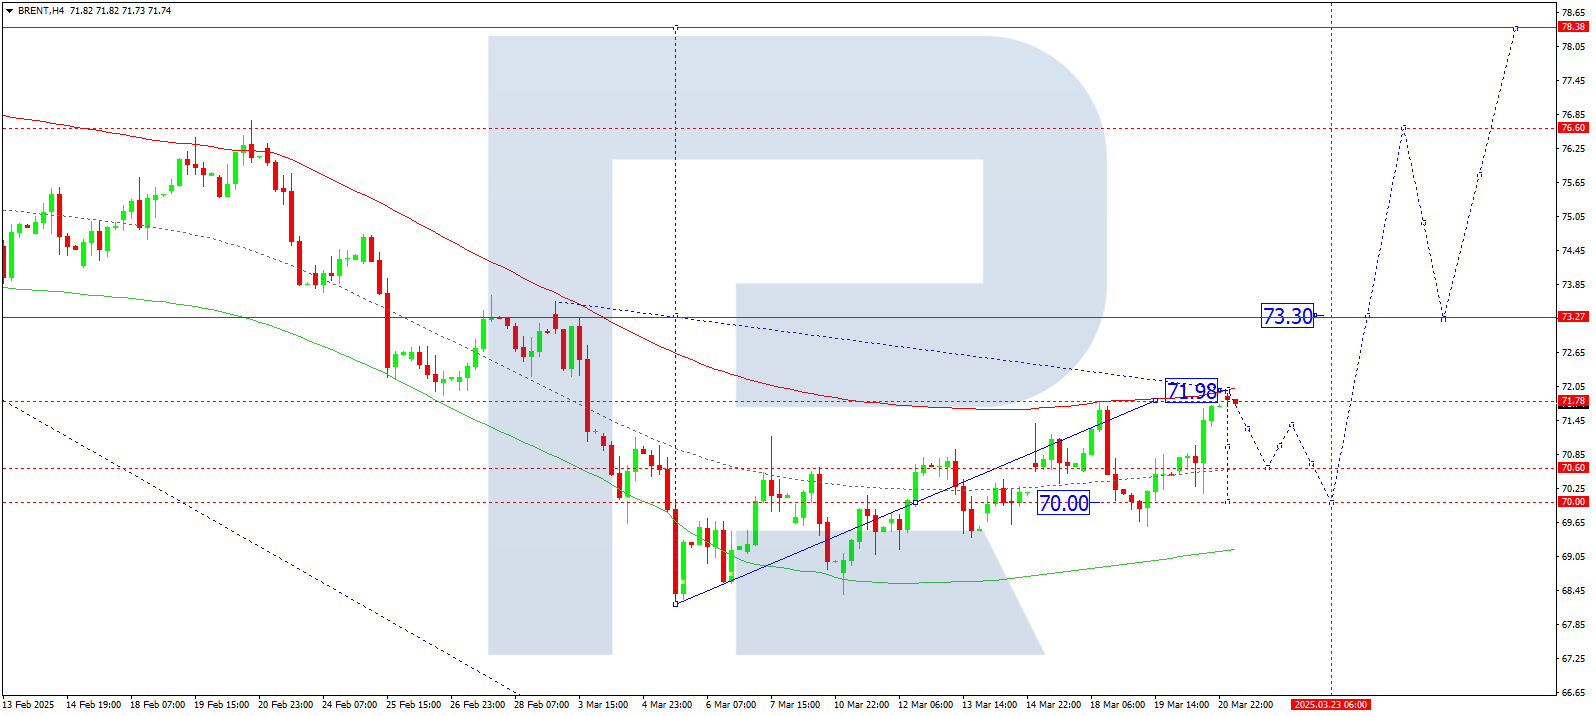
Brent forecast
On the H4 chart of Brent crude, the market completed a growth wave to 71.98. Today, 21 March 2025, we expect a correction at least to 70.60. After this correction, a new growth wave towards 73.30 may begin.
Technically, this scenario is confirmed by the specified Elliott wave structure and the matrix of the upward wave with a pivot at 70.00, which is considered key for Brent. Currently, the market has formed a growth structure towards the upper boundary of the Price Envelope – 71.98. A correction towards the central line – 70.60 – is now anticipated.
Technical indicators in today’s Brent forecast suggest a correction towards 70.60.
Forecasts presented in this section only reflect the author’s private opinion and should not be considered as guidance for trading. RoboForex bears no responsibility for trading results based on trading recommendations described in these analytical reviews.