EURUSD, USDJPY, GBPUSD, AUDUSD, USDCAD, XAUUSD, and Brent technical analysis and forecast for 28 March 2025
Here is a detailed daily technical analysis and forecast for EURUSD, USDJPY, GBPUSD, AUDUSD, USDCAD, XAUUSD, and Brent for 28 March 2025.
EURUSD forecast
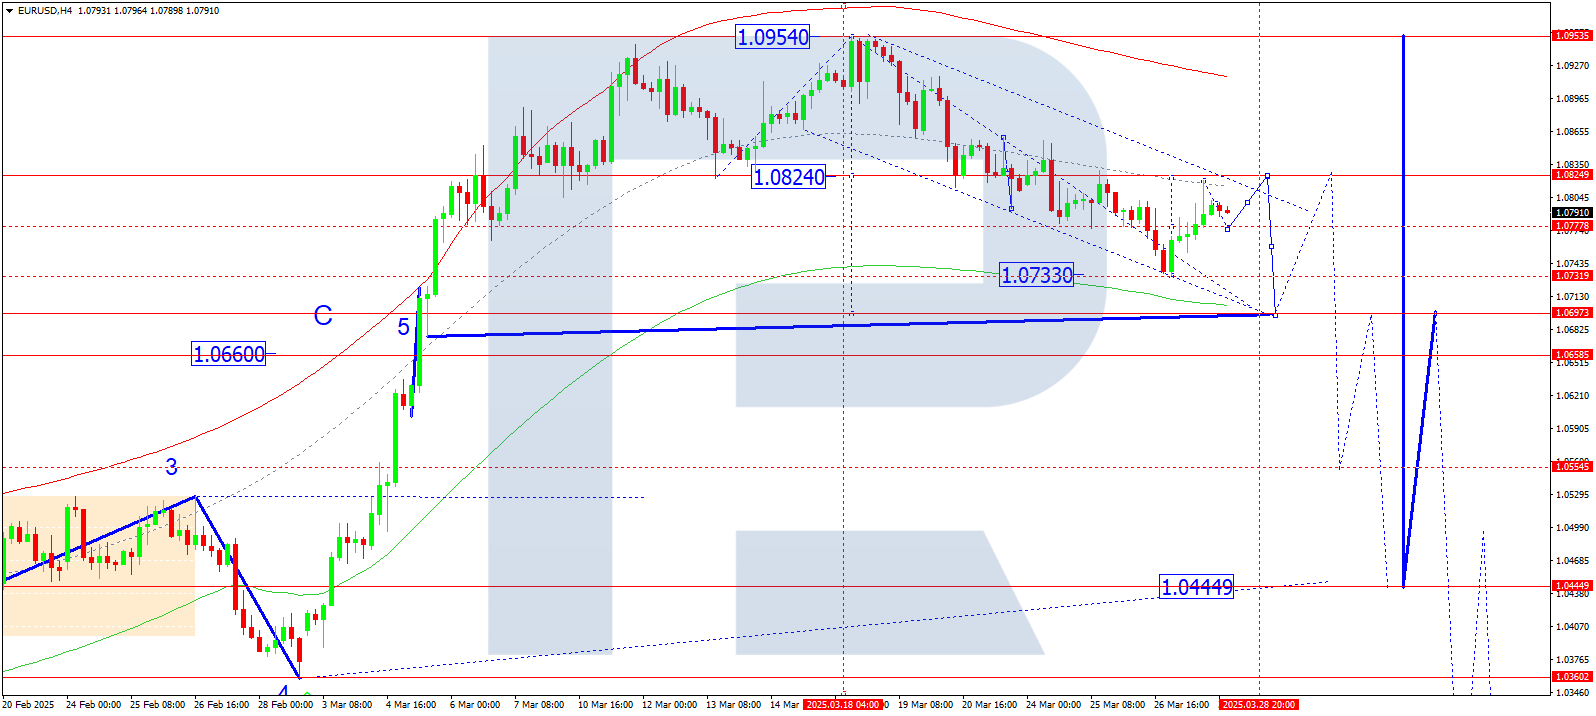
On the H4 chart of EURUSD, the market has reached the local correction target at 1.0820. Today, 28 March 2025, a decline towards 1.0777 is possible. After that, a continuation of the correction wave towards 1.0825 may follow. Once this correction completes, a new downward wave may develop towards 1.0697, the first target.
Technically, the Elliott wave structure and the decline wave matrix with a pivot at 1.0825 confirm this scenario, which is considered key for EURUSD. A rise towards the central line of the price Envelope at 1.0825 is anticipated, followed by a possible drop to its lower boundary at 1.0697.
Technical indicators for today’s EURUSD forecast suggest a potential move down to 1.0697.
USDJPY forecast
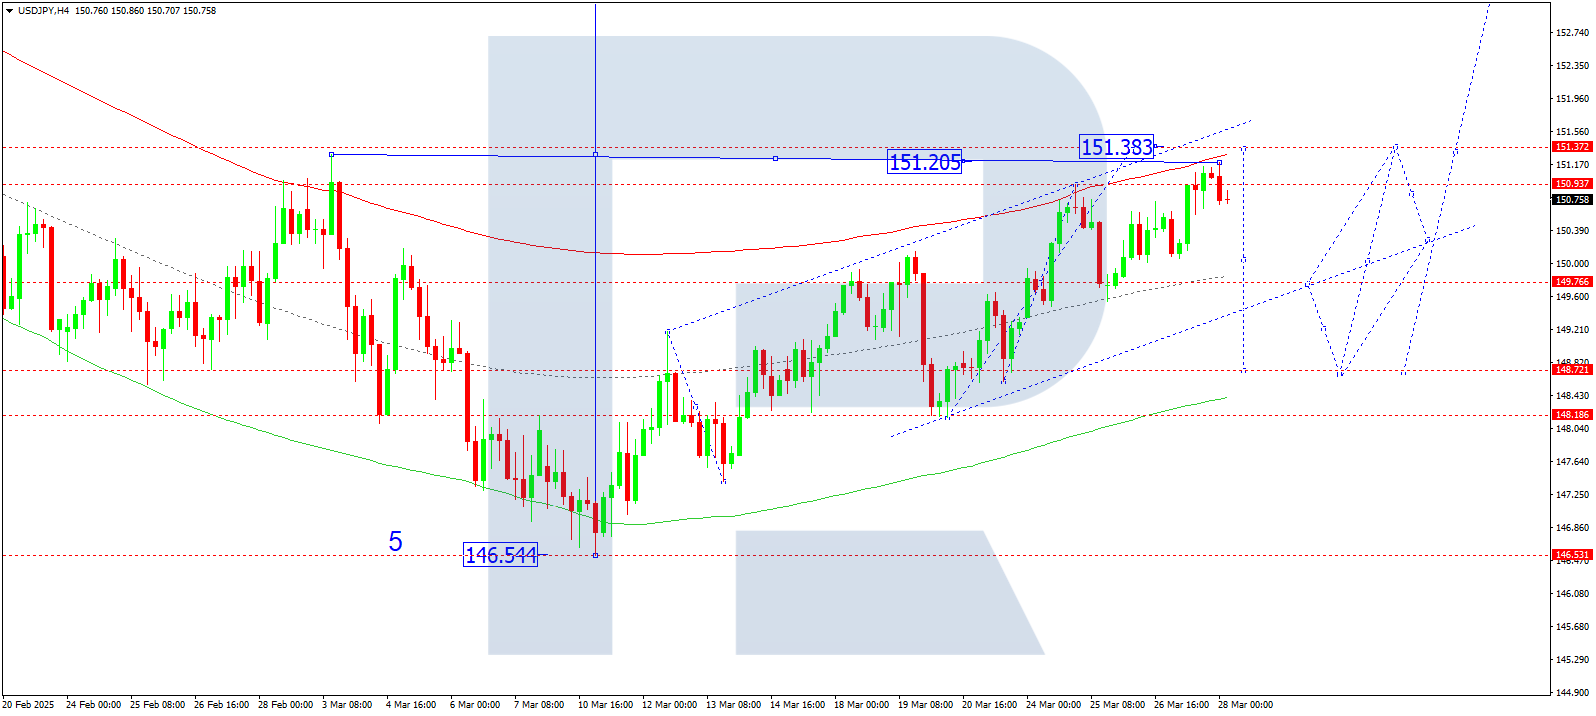
On the H4 chart of USDJPY, the market reached 151.20 in its growth wave. Today, 28 March 2025, an additional move towards 151.38 is not excluded. After that, a decline to 148.72 is expected. Once this target is hit, a new upward wave to the local target of 153.88 may develop.
Technically, the Elliott wave structure and the growth wave matrix with a pivot at 148.72 support this scenario. The market is currently consolidating near the upper boundary of the price Envelope. After this growth wave finishes, a correction towards the lower boundary at 148.72 is likely.
Technical indicators for today’s USDJPY forecast suggest the beginning of a corrective wave to 148.72.
GBPUSD forecast
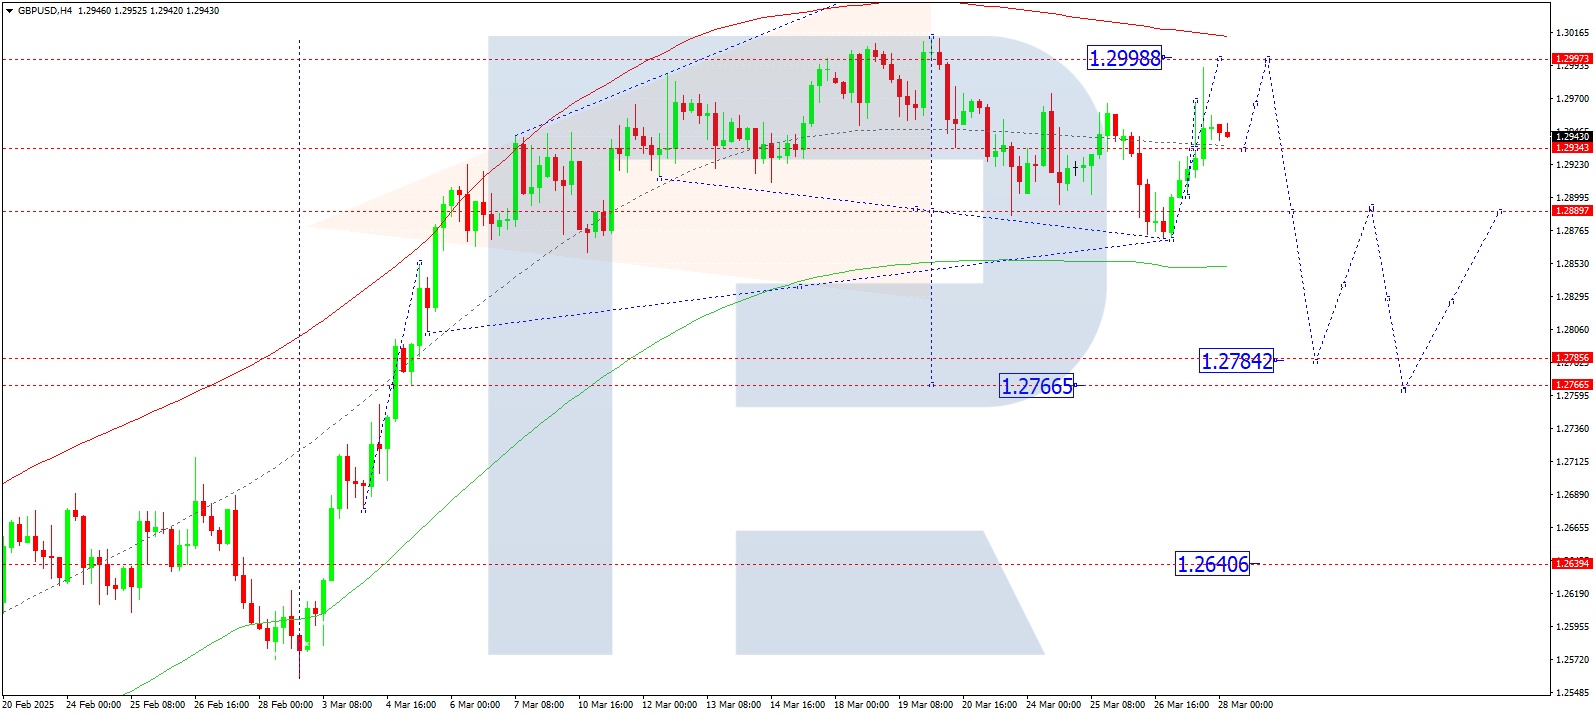
On the H4 chart of GBPUSD, the market completed a correction wave to 1.2991. It is currently forming a downward structure to 1.2934. Today, 28 March 2025, this level may be reached. Once the correction is completed, a new upward wave to 1.2998 is likely to begin.
Technically, the Elliott wave structure and the decline wave matrix with a pivot at 1.2950 confirm this scenario. The market is forming a consolidation range around this level. A rise towards the upper boundary of the price Envelope at 1.2998 is expected, followed by a decline towards the lower boundary at 1.2766.
Technical indicators for today’s GBPUSD forecast suggest a possible upward move to 1.2998.
AUDUSD forecast
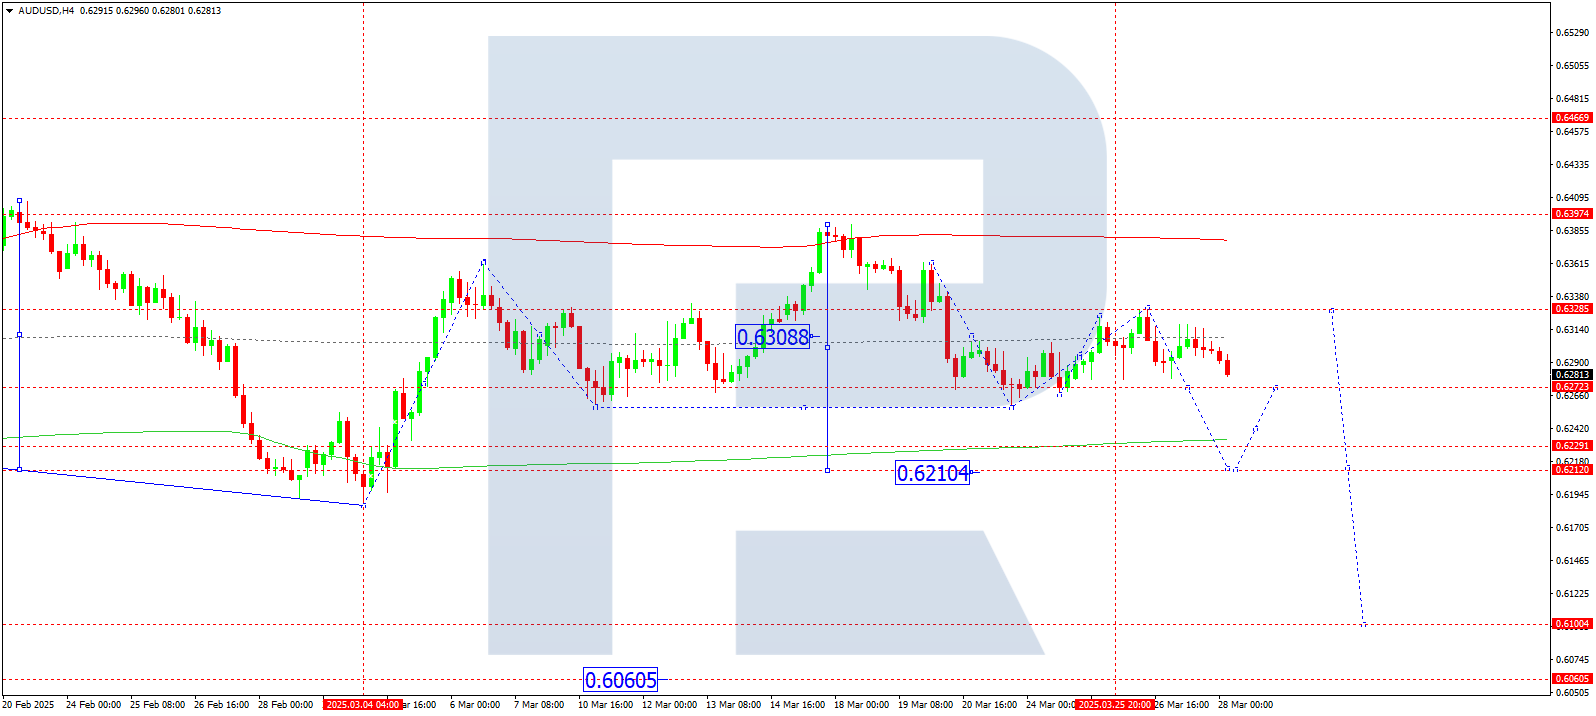
On the H4 chart of AUDUSD, the market completed a correction to 0.6329. Today, 28 March 2025, a new downward wave may begin towards 0.6212. If this level is broken, the wave may extend further to 0.6100, the local target.
Technically, the Elliott wave structure and the decline wave matrix for AUDUSD with a pivot at 0.6300 support this scenario. The market is currently consolidating around the central line of the price Envelope at 0.6300. A decline to its lower boundary at 0.6212 is expected.
Technical indicators for today’s AUDUSD forecast suggest a continued move down to 0.6212.
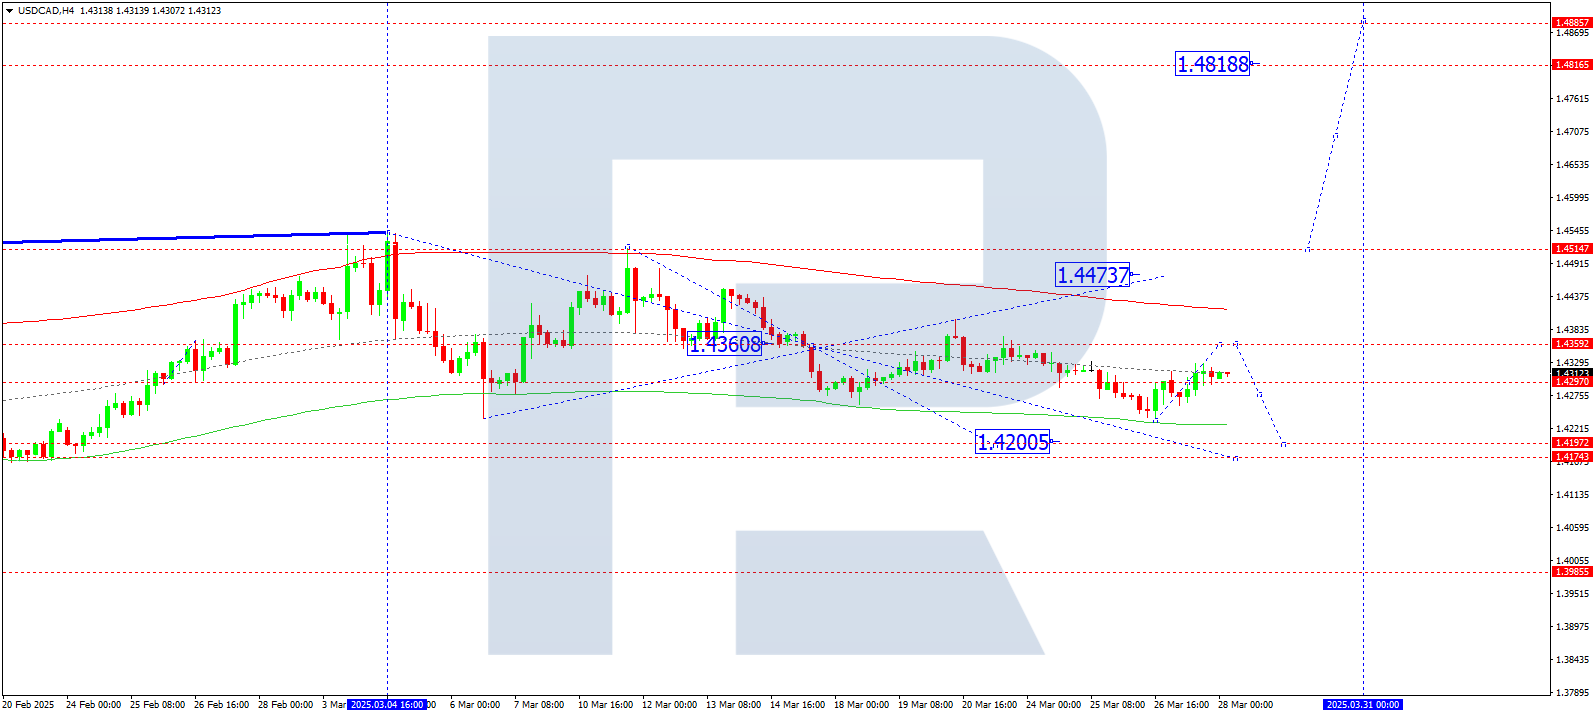
USDCAD forecast
On the H4 chart of USDCAD, the market is forming a growth wave towards 1.4350. Today, 28 March 2025, this target is likely to be reached. After that, a new downward wave may develop towards 1.4200.
Technically, the Elliott wave structure and the decline wave matrix with a pivot at 1.4350 support this scenario. This level is considered crucial for the USDCAD structure. Currently, the market is moving towards the lower boundary of the price Envelope at 1.4200, after which a rise to its upper boundary at 1.4350 may follow.
Technical indicators for today’s USDCAD forecast suggest a decline to 1.4200.
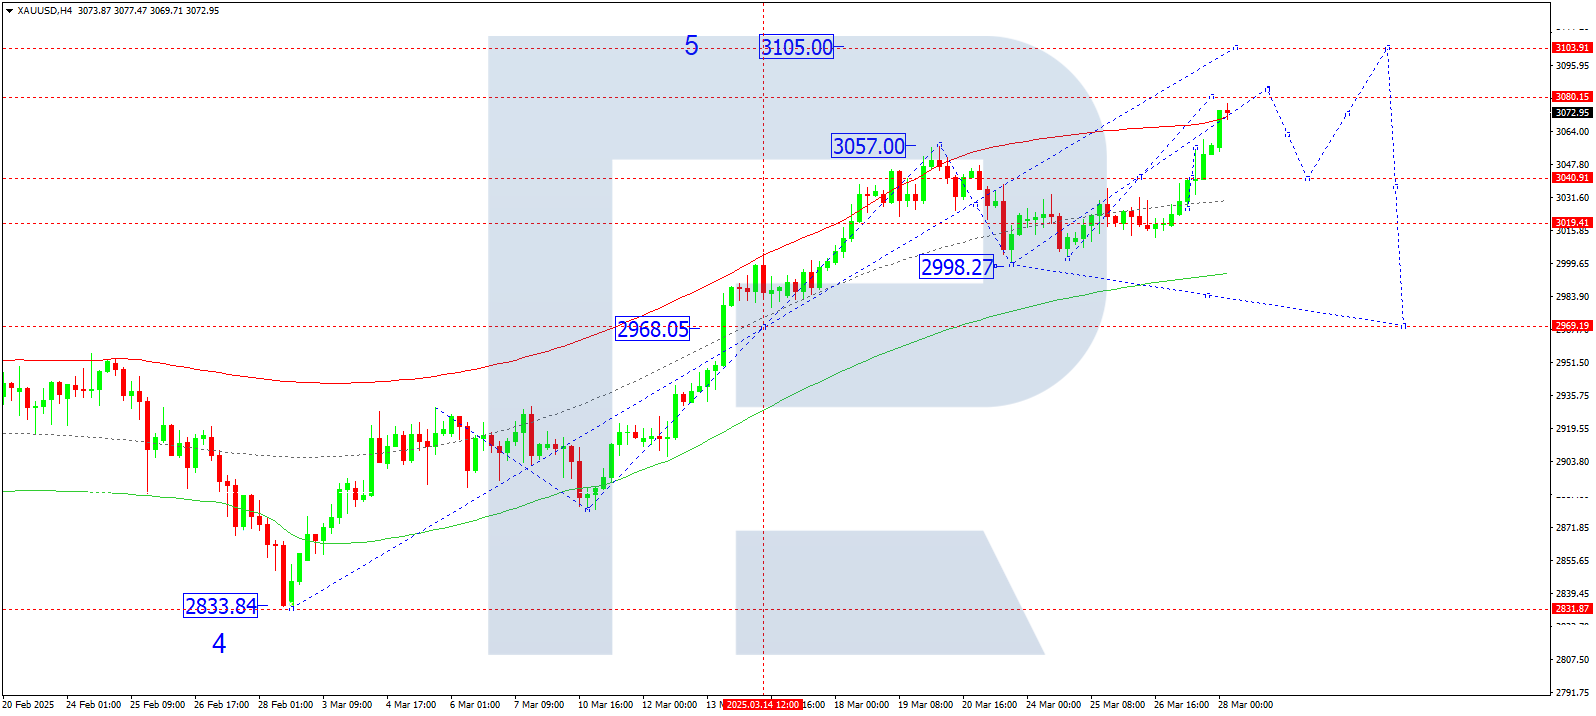
XAUUSD forecast
On the H4 chart of XAUUSD, the market completed a growth wave to 3,040. A consolidation range has formed, and with an upward breakout, the market suggests a continuation of the uptrend towards 3,080 with potential extension to 3,100. Today, 28 March 2025, this target may be reached. After that, a downward wave to 2,970 is likely.
Technically, the Elliott wave structure and the growth wave matrix with a pivot at 2,970 confirm this scenario, which is seen as key for XAUUSD. The market continues to move towards the upper boundary of the Price Envelope at 3,080. A drop to the lower boundary at 2,970 may follow after the upward target is reached.
Technical indicators for today’s XAUUSD forecast indicate the potential for continued growth to 3,080 and 3,100.
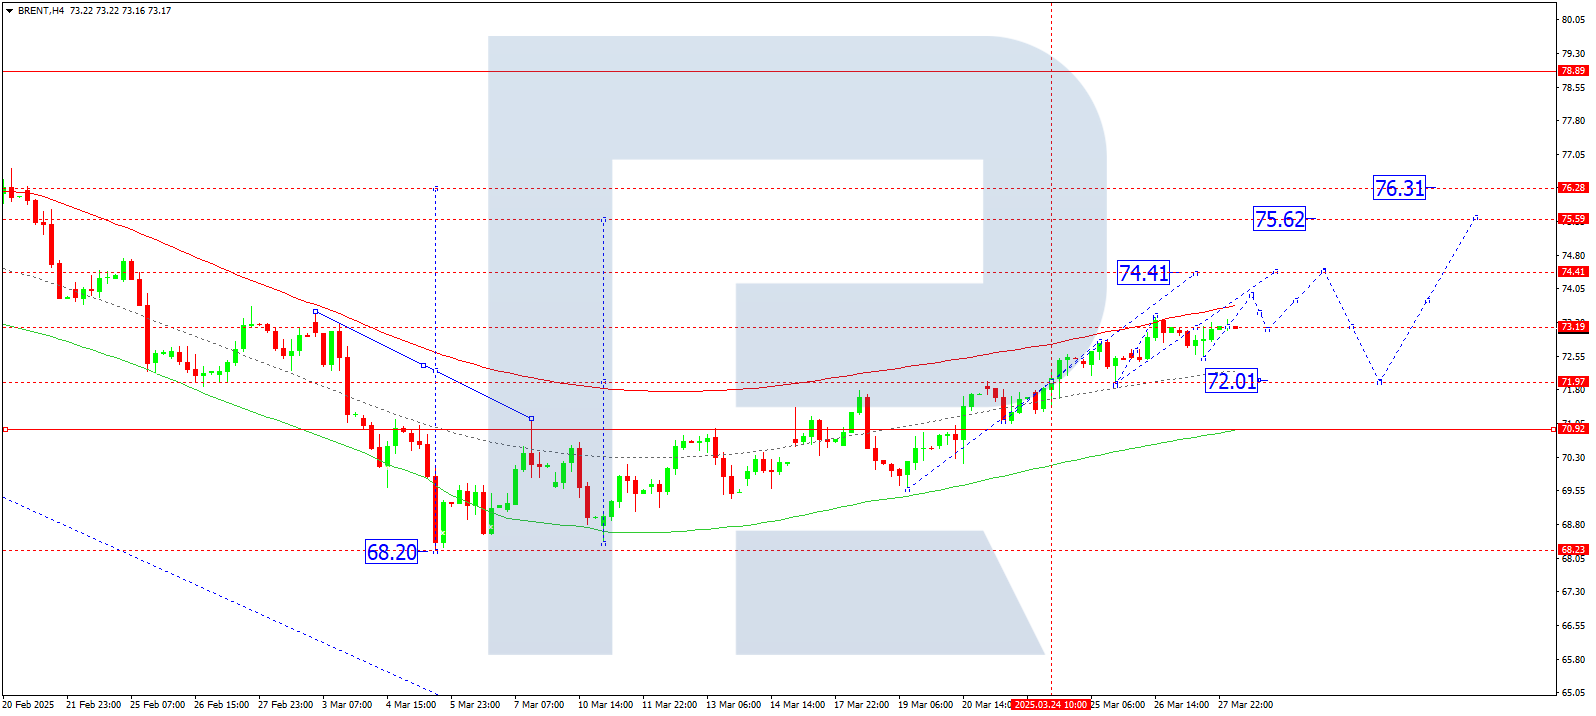
Brent forecast
On the H4 chart of Brent crude, the market continues developing a growth wave structure towards 74.40. Today, 28 March 2025, this target may be achieved. After that, a correction down to 72.00 is likely.
Technically, the Elliott wave structure and the growth wave matrix with a pivot at 72.00 support this scenario, which is considered crucial for Brent. The market is currently moving towards the upper boundary of the price Envelope at 74.40. A correction to the lower boundary at 72.00 may follow.
Technical indicators in today’s Brent forecast suggest continued growth to 74.40.
Forecasts presented in this section only reflect the author’s private opinion and should not be considered as guidance for trading. RoboForex bears no responsibility for trading results based on trading recommendations described in these analytical reviews.