EURUSD, USDJPY, GBPUSD, AUDUSD, USDCAD, XAUUSD, and Brent technical analysis and forecast for 20 March 2025
Here is a detailed daily technical analysis and forecast for EURUSD, USDJPY, GBPUSD, AUDUSD, USDCAD, XAUUSD, and Brent for 20 March 2025.
EURUSD forecast
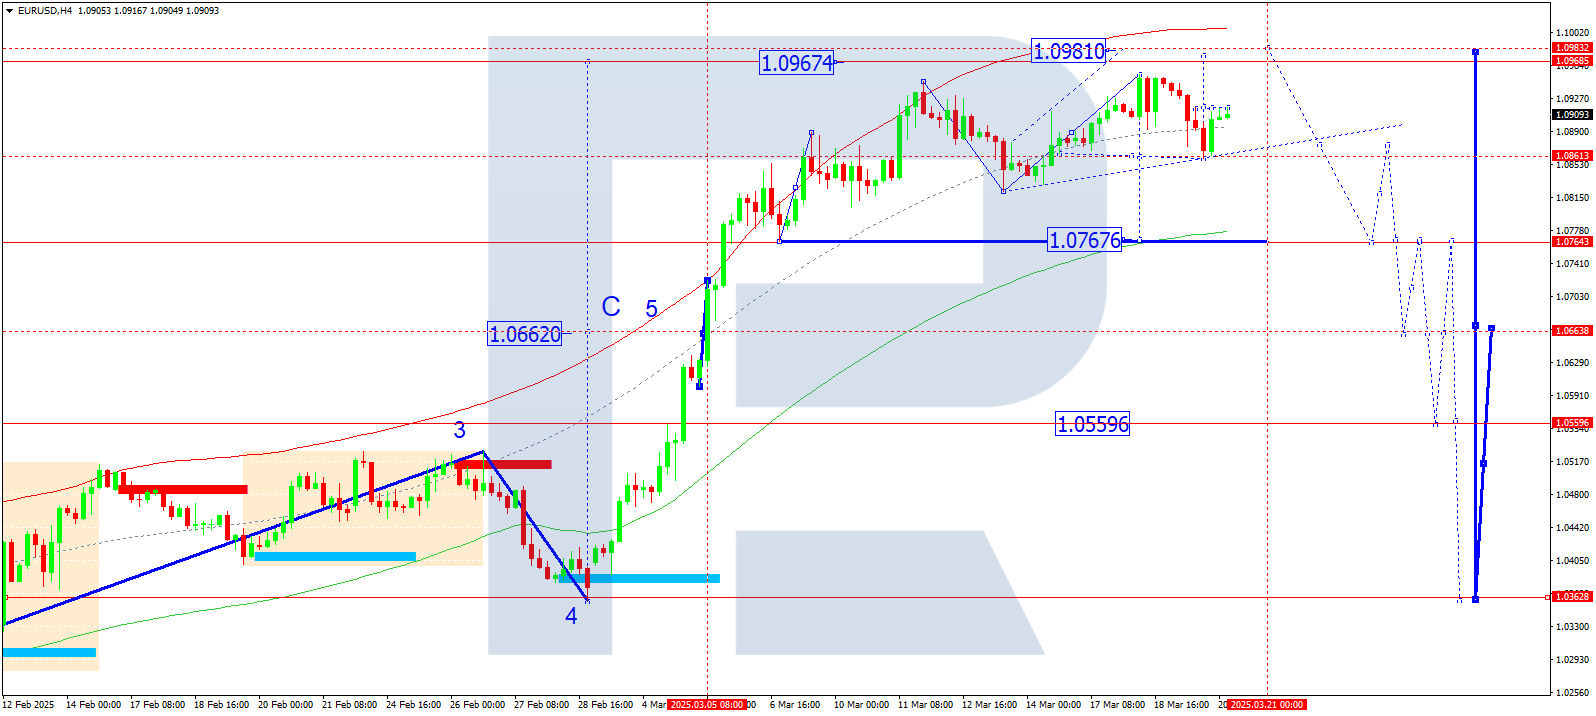
On the H4 chart of EURUSD, the market completed a decline to 1.0860, followed by a correction to 1.0916. This effectively defined the boundaries of a new consolidation range around the latter level. Today, 20 March 2025, if the price exits the range upwards, a potential growth wave towards 1.0968 may develop. Conversely, if the price exits downward, a further decline to 1.0767 is possible.
Technically, this scenario is confirmed by the Elliott wave structure and the growth wave matrix with a pivot point at 1.0662, which is key for EURUSD. The market is currently forming a consolidation range near the upper boundary of the Price Envelope. If the price breaks downward, a reversal pattern will likely develop, signaling a decline towards the lower boundary at 1.0767. If it breaks upward, a surge towards the upper boundary at 1.0968 is possible, marking the exhaustion of this growth wave.
Technical indicators for today’s EURUSD forecast suggest a possible decline to 1.0767.
USDJPY forecast
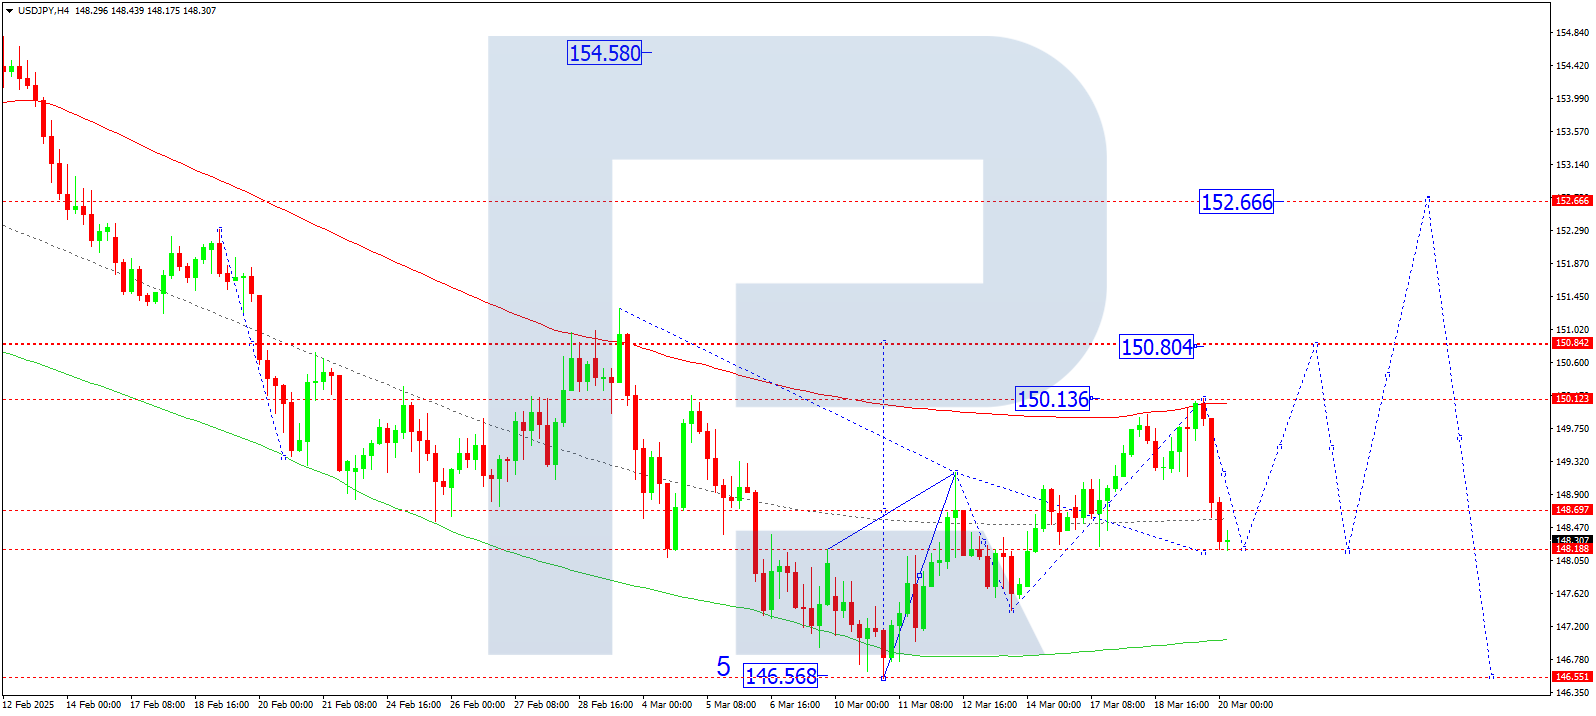
On the H4 chart of USDJPY, the market completed a decline to 148.18. Today, 20 March 2025, we expect an upward movement to 150.80, indicating the potential formation of the first wave of growth. After this, a correction to 148.70 may follow.
Technically, this scenario is confirmed by the Elliott wave structure and the growth wave matrix with a pivot point at 149.70. The market recently corrected to the central line of the Price Envelope at 148.18. Once this correction is complete, the price is likely to rise toward the upper boundary at 150.80.
Technical indicators for today’s USDJPY forecast suggest a growth wave to 150.80.
GBPUSD forecast
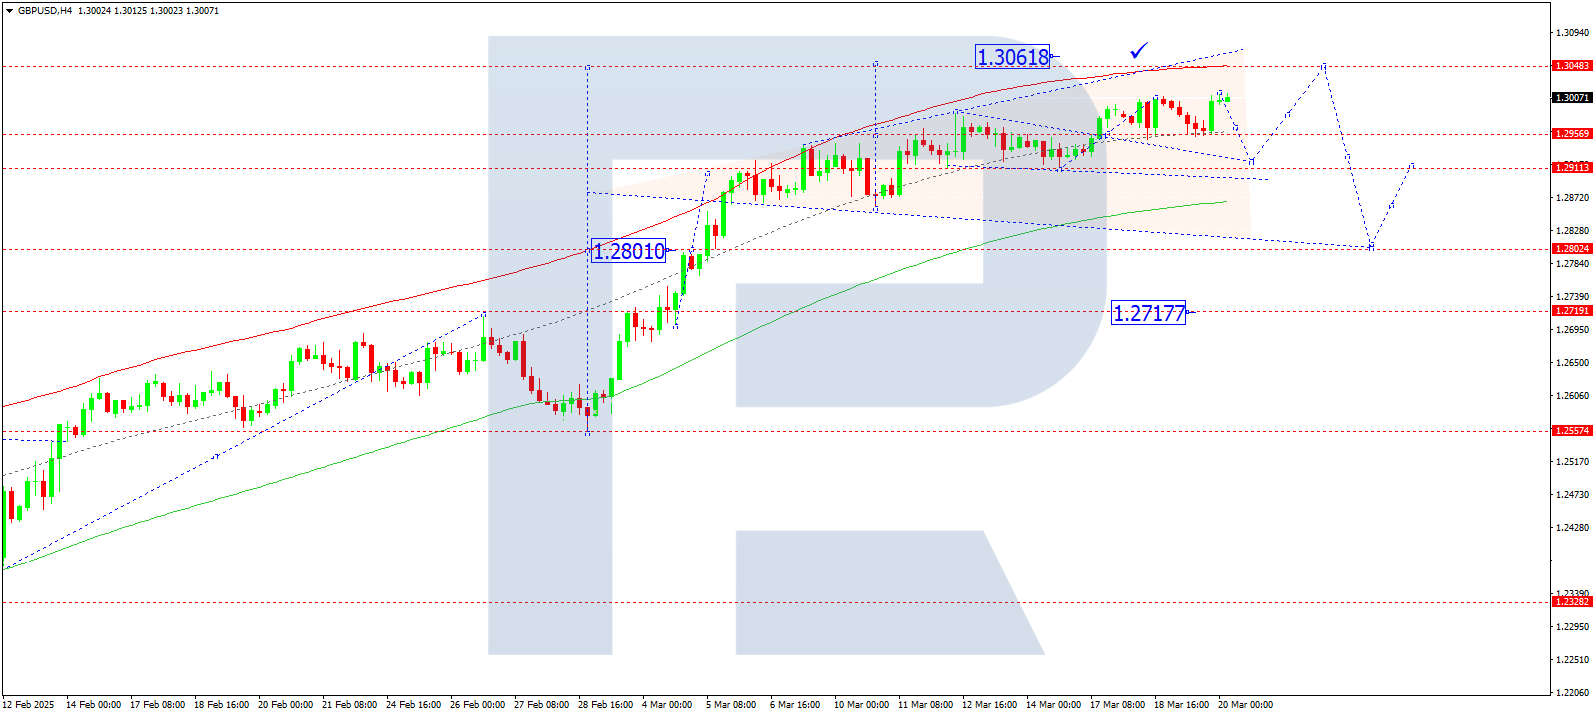
On the H4 chart of GBPUSD, the market continues developing a consolidation range around 1.2956. Today, 20 March 2025, we expect the range to expand downward to 1.2920. Later, an upward expansion to 1.3048 is possible.
Technically, this scenario is confirmed by the Elliott wave structure and the growth wave matrix with a pivot point at 1.2810. The market is currently consolidating near the upper boundary of the Price Envelope. A downward breakout towards the lower boundary at 1.2920 would be a relevant scenario.
Technical indicators for today’s GBPUSD forecast suggest a potential decline to 1.2920.
AUDUSD forecast
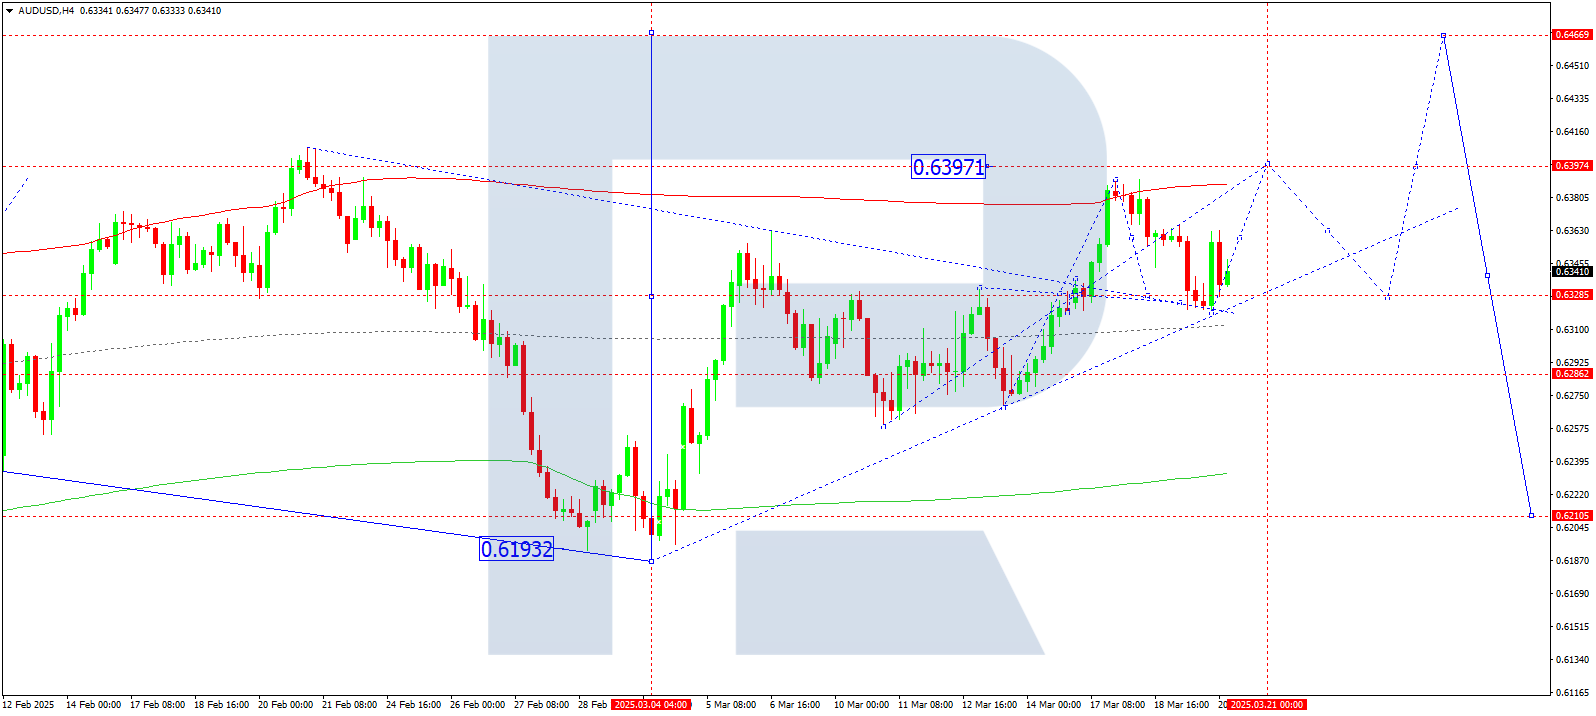
On the H4 chart of AUDUSD, the market corrected to 0.6320. Today, 20 March 2025, we expect an upward movement to 0.6397, with a possible continuation towards 0.6444.
Technically, this scenario is confirmed by the Elliott wave structure and the growth wave matrix with a pivot point at 0.6328. The correction to the central line of the Price Envelope at 0.6320 has been completed. The next likely step is a new growth wave towards the upper boundary at 0.6397.
Technical indicators for today’s AUDUSD forecast suggest a correction to 0.6328.
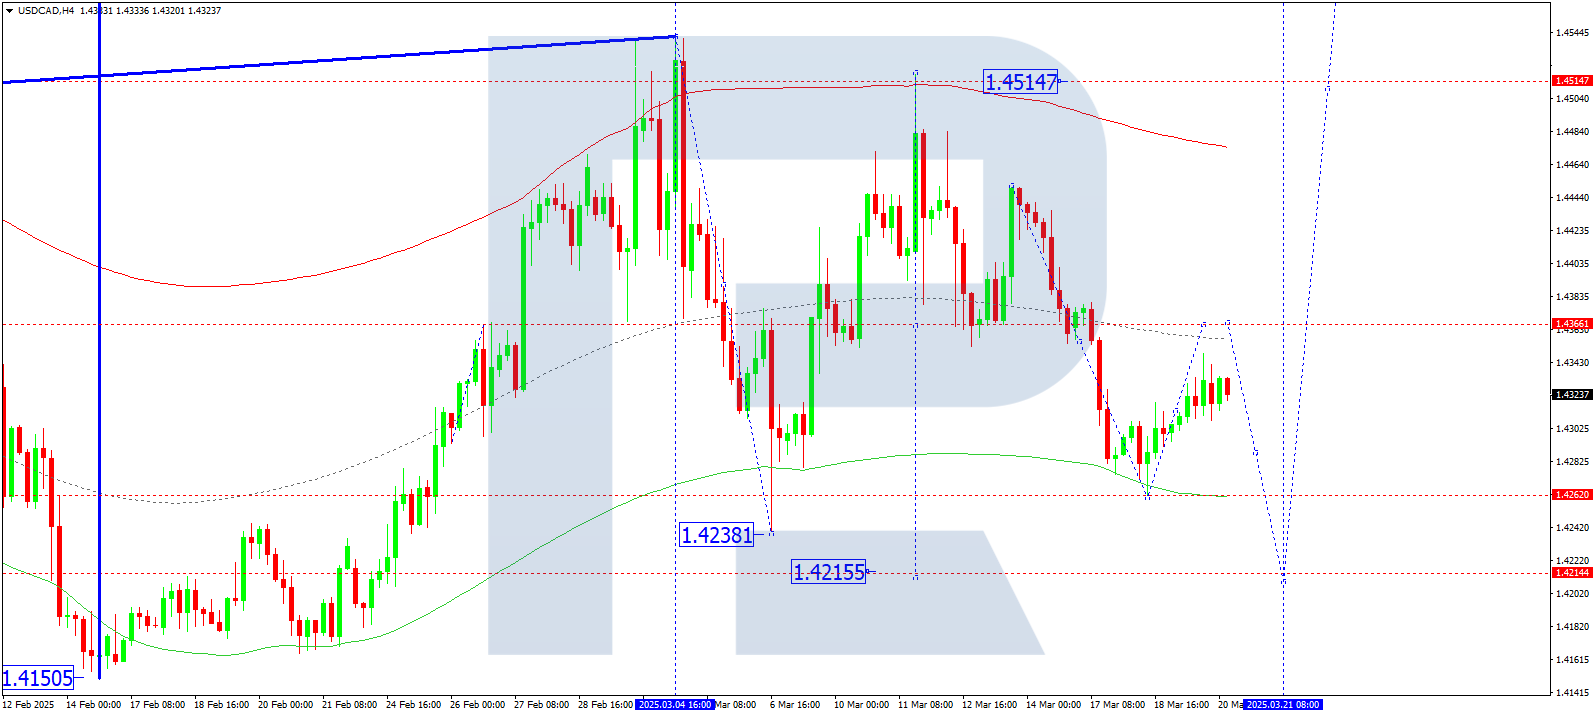
USDCAD forecast
On the H4 chart of USDCAD, the market is forming a growth wave towards 1.4366. Today, 20 March 2025, we expect this level to be reached. Later, a decline to 1.4215 may follow.
Technically, this scenario is confirmed by the Elliott wave structure and the downward wave matrix with a pivot point at 1.4366. This level is considered key for USDCAD in this wave structure. The market has currently declined to the lower boundary of the Price Envelope at 1.4278. A growth wave towards the central line at 1.4366 is expected.
Technical indicators for today’s USDCAD forecast suggest a growth wave to 1.4366.
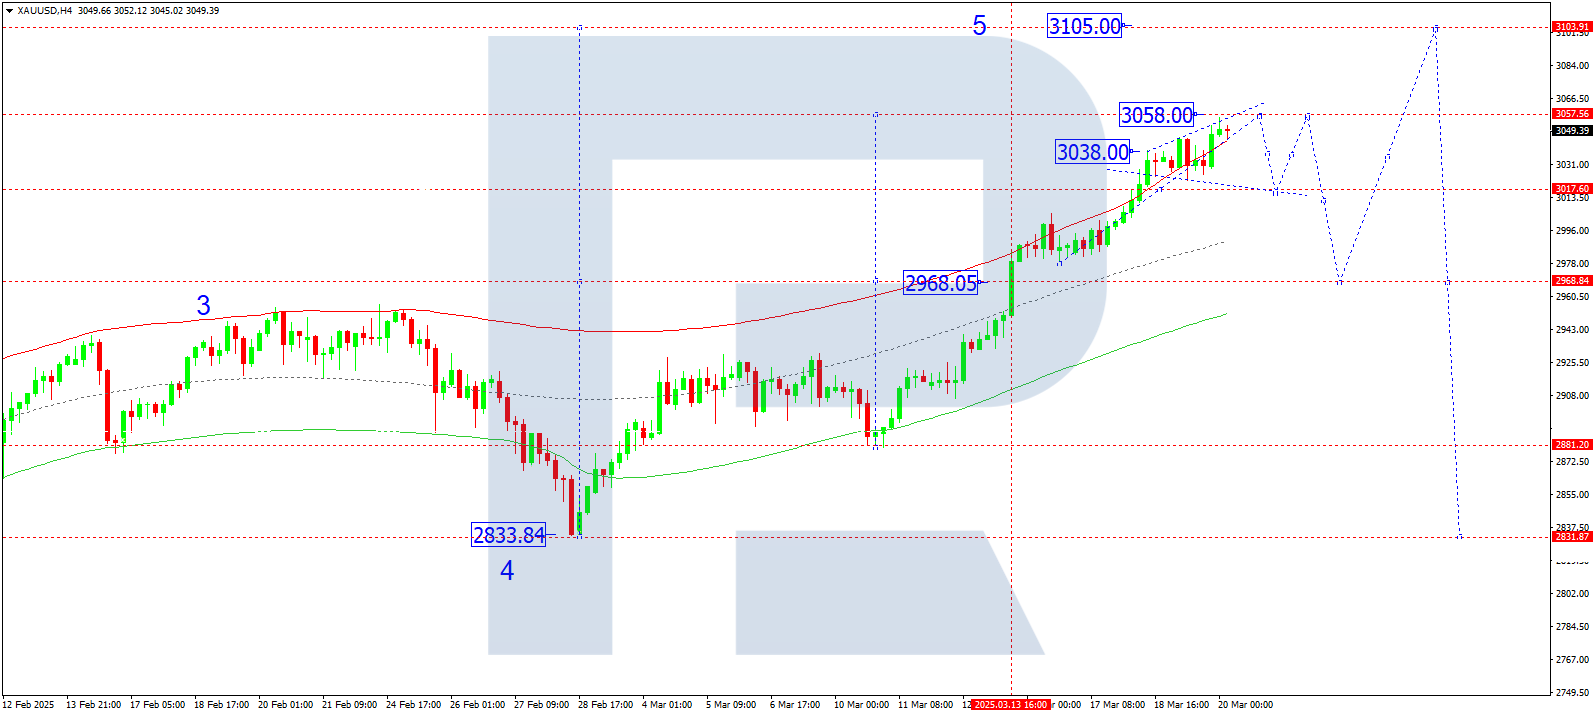
XAUUSD forecast
On the H4 chart of XAUUSD, the market continues its growth wave towards 3,058. Today, 20 March 2025, a widening consolidation range has formed around this level. A surge towards 3,058 is expected. After reaching this level, a correction to 3,010 may follow. Once the correction is complete, growth towards 3,100 is anticipated.
Technically, this scenario is confirmed by the Elliott wave structure and the growth wave matrix with a pivot point at 2,945, which is key for XAUUSD in this wave. The market is currently advancing towards the upper boundary of the Price Envelope at 3,058. Later, a decline towards the central line at 3,010 is expected.
Technical indicators for today’s XAUUSD forecast suggest a potential growth wave to 3,058.
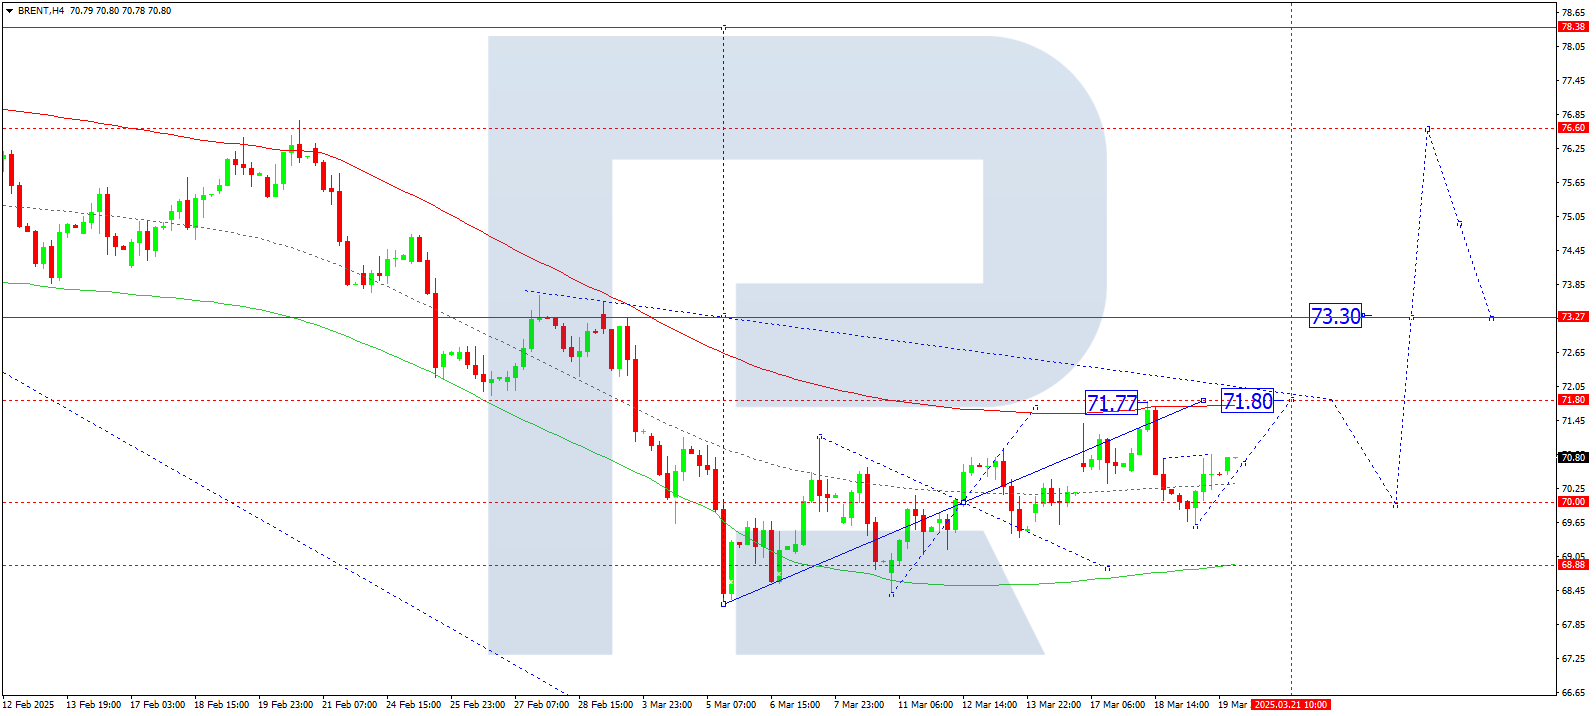
Brent forecast
On the H4 chart of Brent crude oil, the market executed an impulse growth wave to 70.70. Today, 20 March 2025, we expect the growth wave to extend towards 71.80, with a potential continuation towards 73.30.
Technically, this scenario is confirmed by the Elliott wave structure and the growth wave matrix with a pivot point at 70.00, which is key for Brent. The market is currently forming a growth structure towards the upper boundary of the Price Envelope at 71.80. Later, a correction towards the lower boundary at 70.00 may follow.
Technical indicators for today’s Brent forecast suggest further growth towards 71.80.
Forecasts presented in this section only reflect the author’s private opinion and should not be considered as guidance for trading. RoboForex bears no responsibility for trading results based on trading recommendations described in these analytical reviews.