EURUSD, USDJPY, GBPUSD, AUDUSD, USDCAD, XAUUSD, and Brent technical analysis and forecast for 19 March 2025
Here is a detailed daily technical analysis and forecast for EURUSD, USDJPY, GBPUSD, AUDUSD, USDCAD, XAUUSD, and Brent for 19 March 2025.
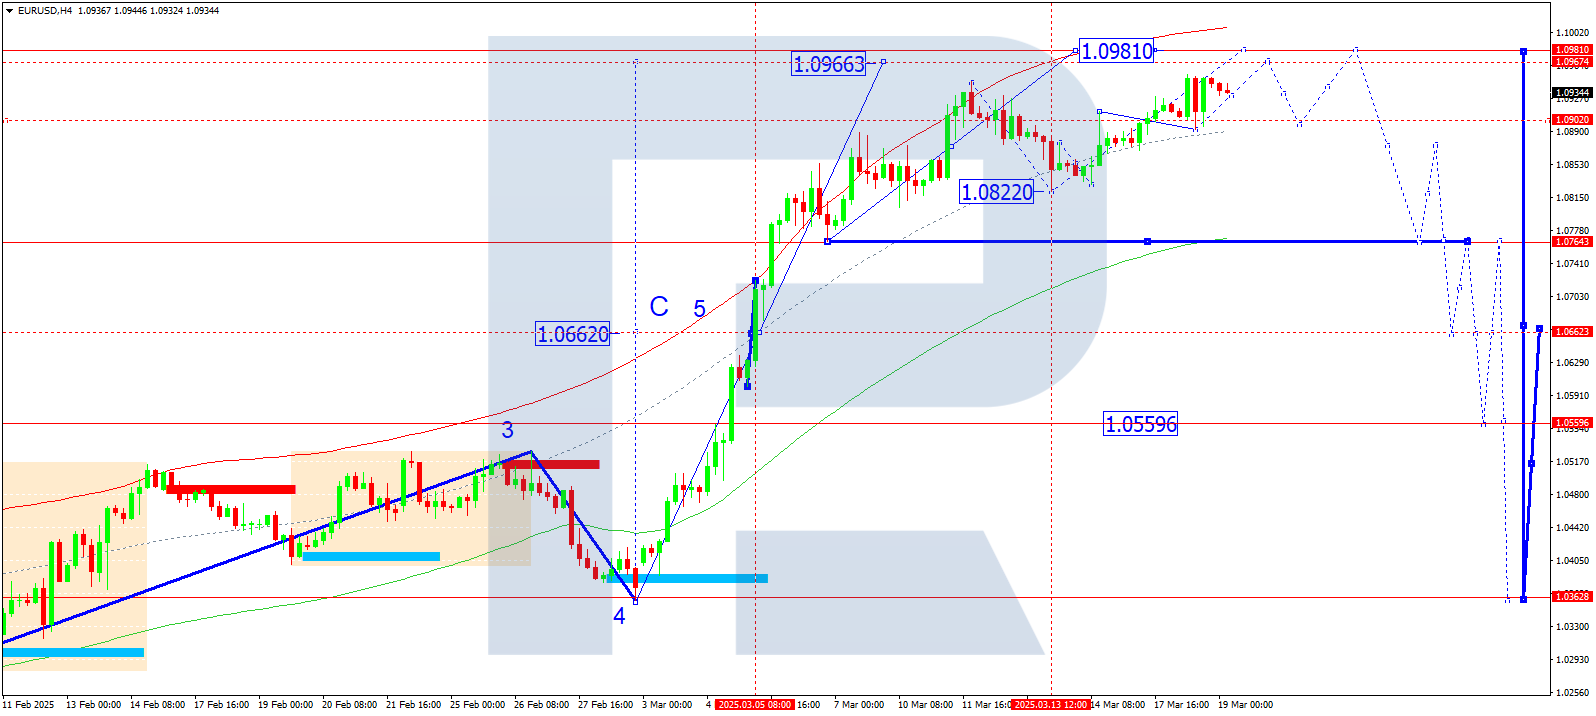
EURUSD forecast
On the H4 chart of EURUSD, the market completed a growth wave to 1.0954 and corrected to 1.0892. Today, 19 March 2025, we expect a further growth wave to 1.0967. A correction to 1.0900 may follow. After that, another upward move to 1.0981 is likely, marking the exhaustion of this growth wave.
Technically, this scenario is confirmed by the Elliott wave structure and the growth wave matrix with a pivot point at 1.0662, which is key for EURUSD. The market is currently forming the final growth wave towards the upper boundary of the Price Envelope at 1.0981. The market has established a consolidation range around its central line at 1.0900. A downward correction toward 1.0840 is possible. If the price exits the range upwards, further growth to the upper boundary at 1.0970 may follow. If it exits downward, we will consider a correction to the lower boundary at 1.0765.
Technical indicators for today’s EURUSD forecast suggest a possible correction to 1.0840.
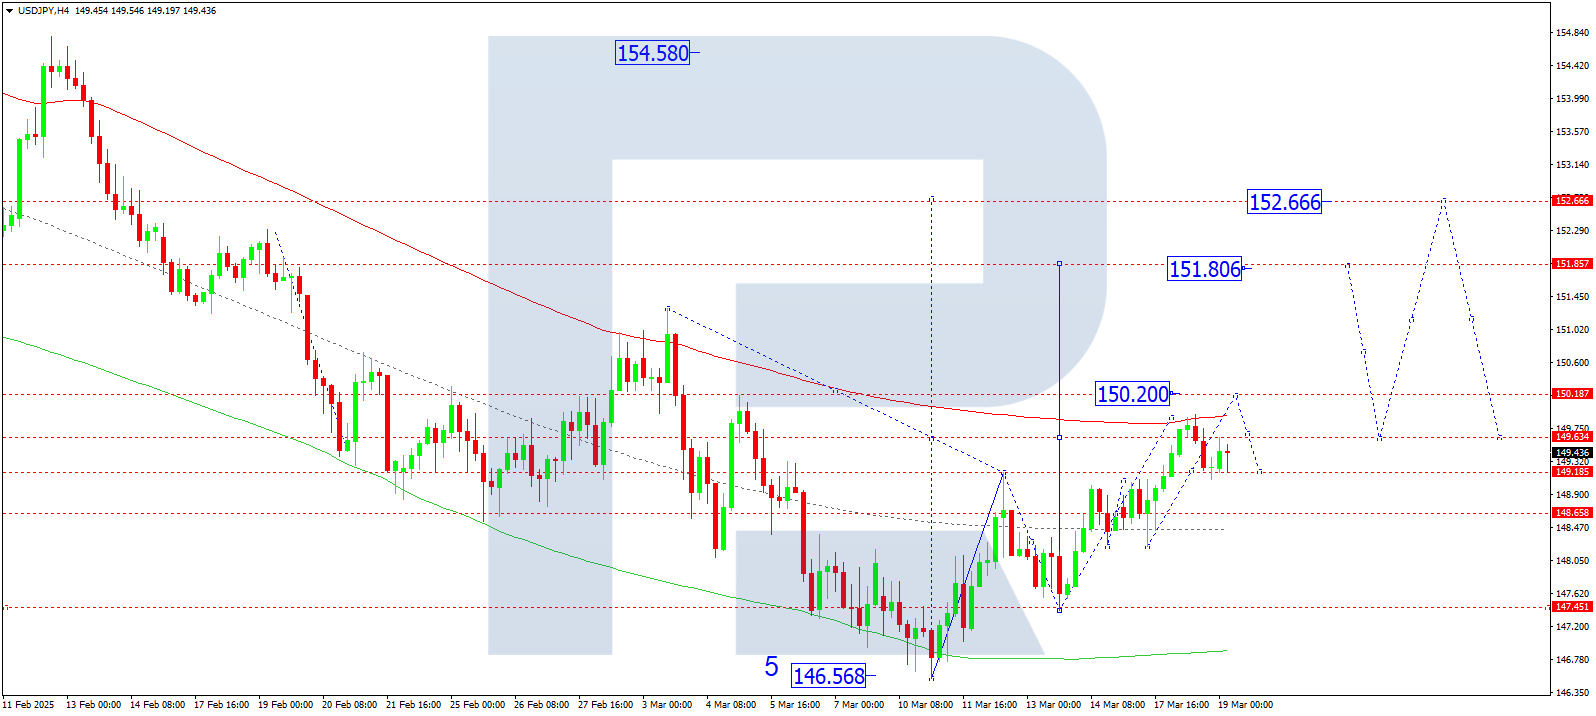
USDJPY forecast
On the H4 chart of USDJPY, the market completed a growth wave to 149.92 and corrected to 149.09. Today, 19 March 2025, an upward movement to 150.20 is expected. A new consolidation range may form at the peak of this growth wave. If the price exits the range upwards, the wave may extend to 151.80, with a further trend continuation to 152.60 as a local target. After reaching this level, a correction to 149.70 may begin.
Technically, this scenario is confirmed by the Elliott wave structure and the growth wave matrix with a pivot point at 149.70. The market is currently forming a growth structure towards the upper boundary of the Price Envelope at 150.20. After reaching this level, a correction to the central line at 149.00 is possible. Later, the trend may continue towards the upper boundary at 151.80.
Technical indicators for today’s USDJPY forecast suggest a growth wave to 150.20 and 151.80.
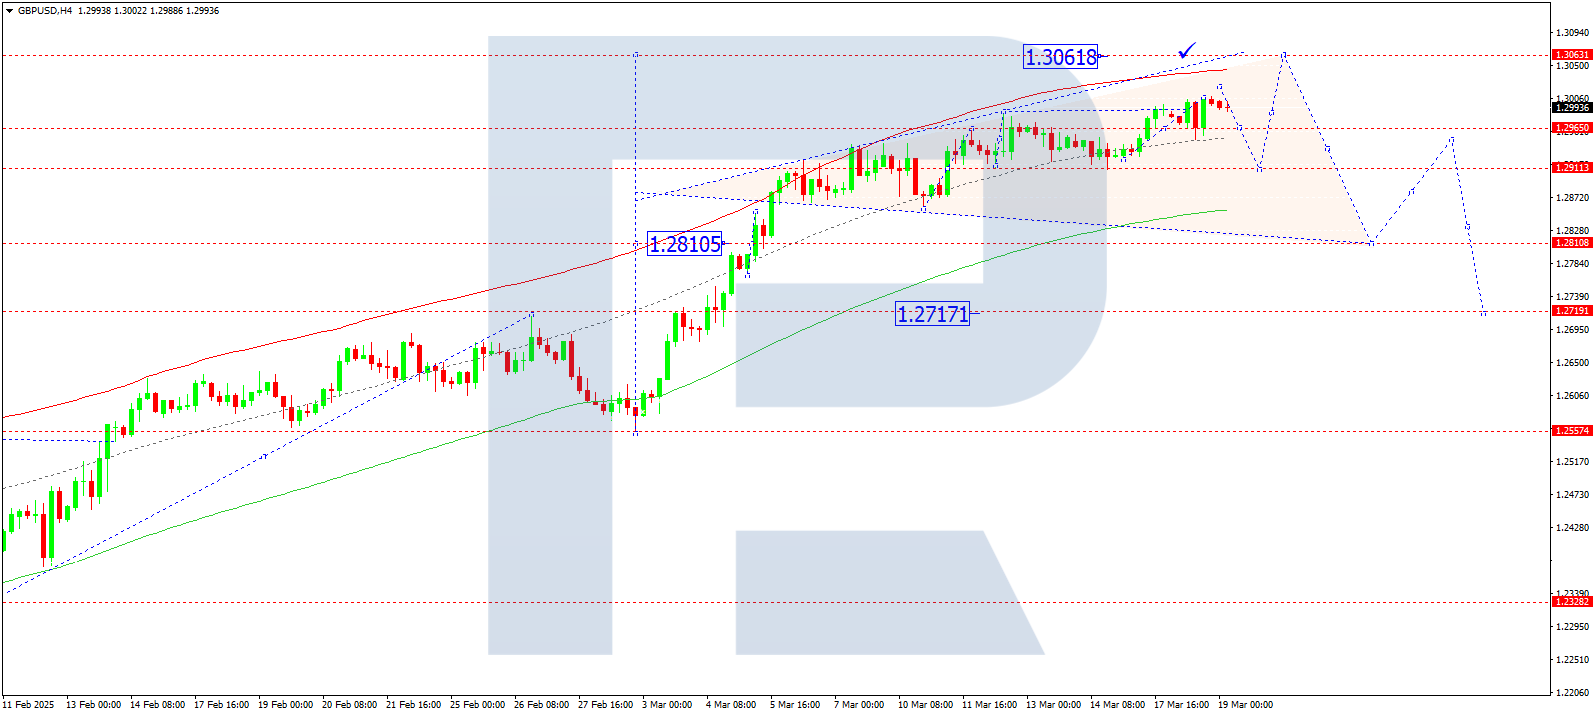
GBPUSD forecast
On the H4 chart of GBPUSD, the market completed a growth wave to 1.3004 and corrected to 1.2952. Today, 19 March 2025, another growth move to 1.3020 and a correction to 1.2910 are expected. Once this correction is complete, a new growth wave to 1.3063 is likely.
Technically, this scenario is confirmed by the Elliott wave structure and the growth wave matrix with a pivot point at 1.2810. The market is currently developing a growth wave towards the upper boundary of the Price Envelope at 1.3063. After reaching this target, a more significant correction to the lower boundary at 1.2810 may follow.
Technical indicators for today’s GBPUSD forecast suggest a continuation of the upward movement to 1.3063.
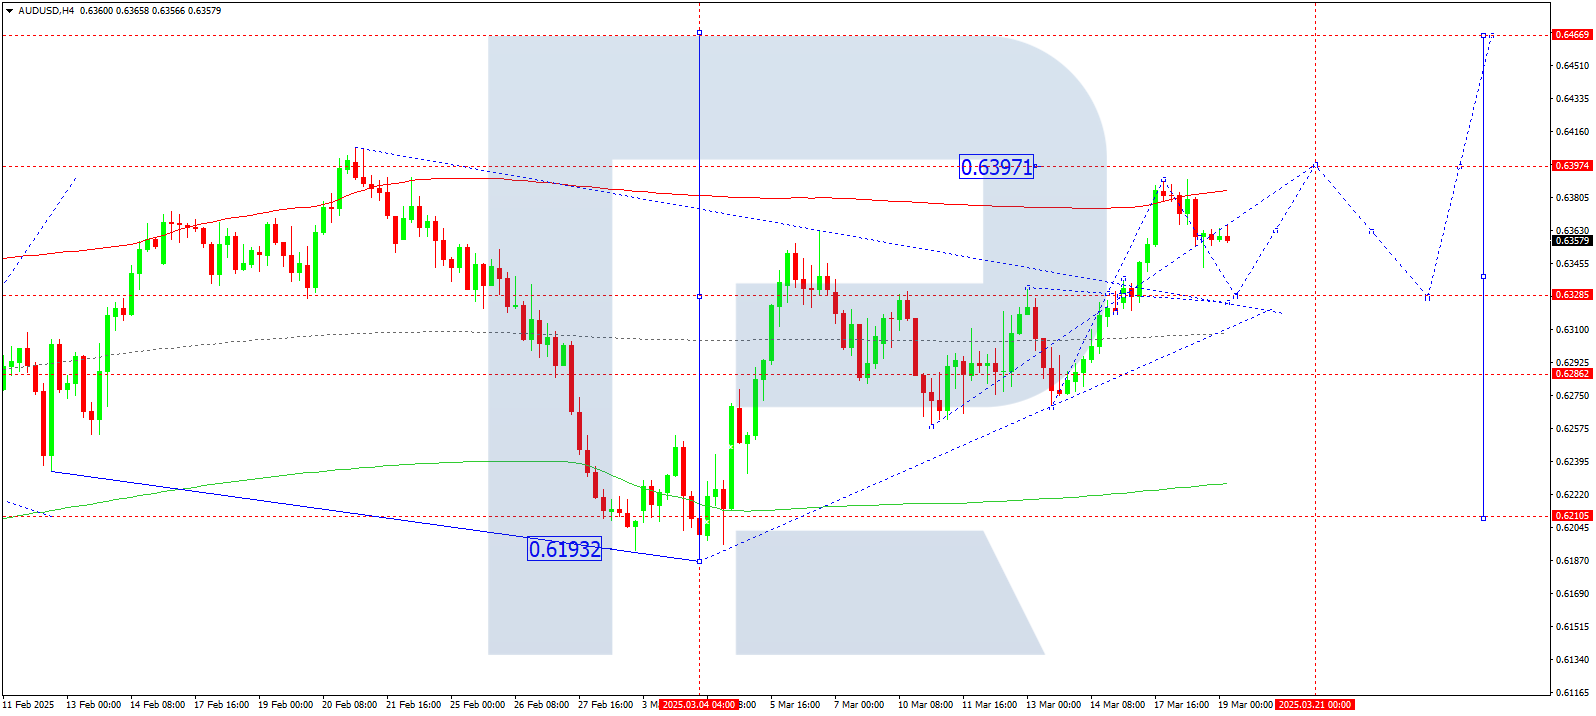
AUDUSD forecast
On the H4 chart of AUDUSD, the market is forming a correction towards 0.6328. Today, 19 March 2025, we expect this level to be reached. After that, a growth wave towards 0.6397 is likely, with a potential continuation towards 0.6444.
Technically, this scenario is confirmed by the Elliott wave structure and the growth wave matrix for AUDUSD with a pivot point at 0.6328. The market is currently forming a corrective structure towards the central line of the Price Envelope at 0.6328. A subsequent growth wave towards the upper boundary at 0.6397 is likely.
Technical indicators for today’s AUDUSD forecast suggest a correction to 0.6328.
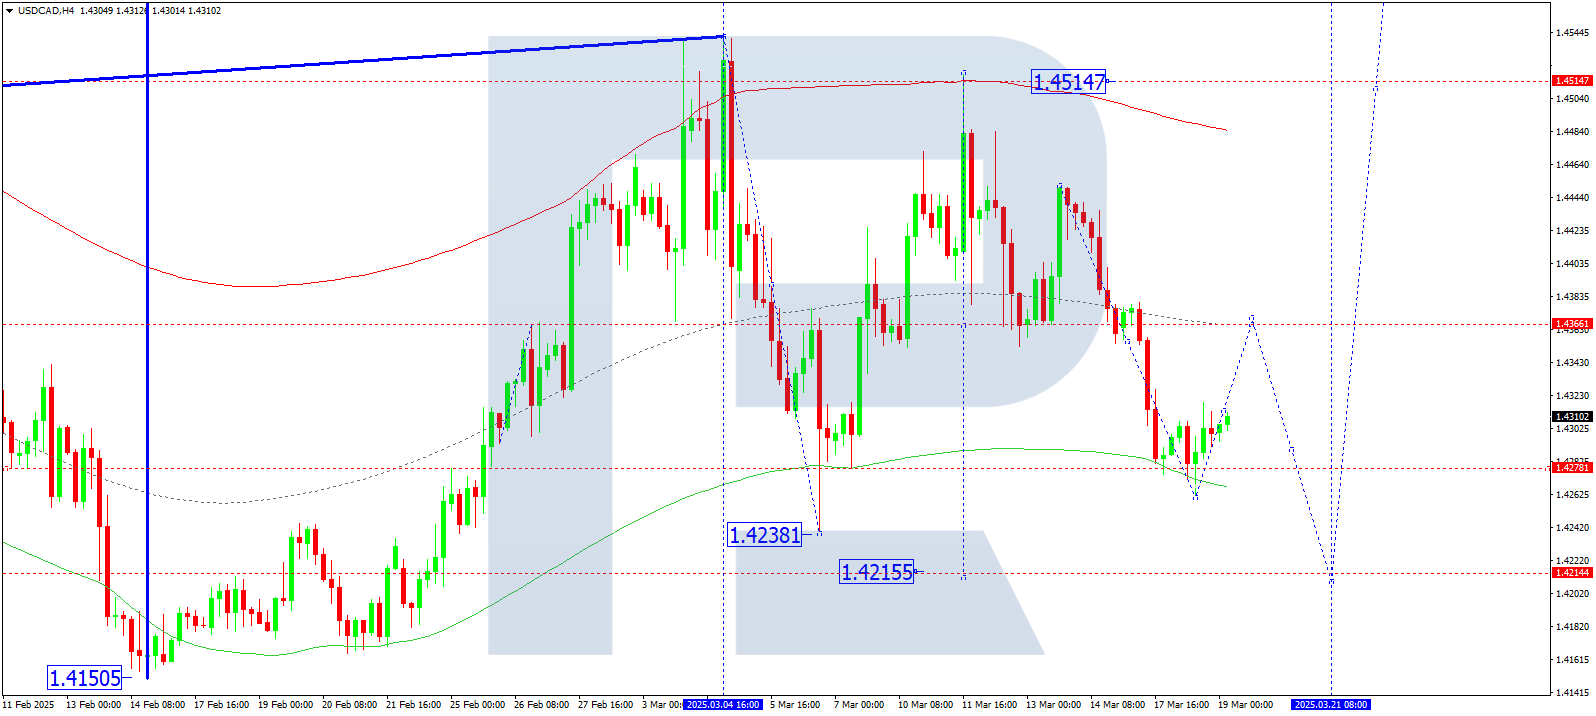
USDCAD forecast
On the H4 chart of USDCAD, the market completed a downward wave to 1.4262. Today, 19 March 2025, an upward movement to 1.4366 (test from below) is expected. After that, a decline towards 1.4215 may follow.
Technically, this scenario is confirmed by the Elliott wave structure and the downward wave matrix with a pivot point at 1.4366. This level is considered key for USDCAD in this wave structure. The market has currently completed a decline to the lower boundary of the Price Envelope at 1.4278. A new growth wave towards the central line at 1.4366 is expected.
Technical indicators for today’s USDCAD forecast suggest a growth wave to 1.4366.
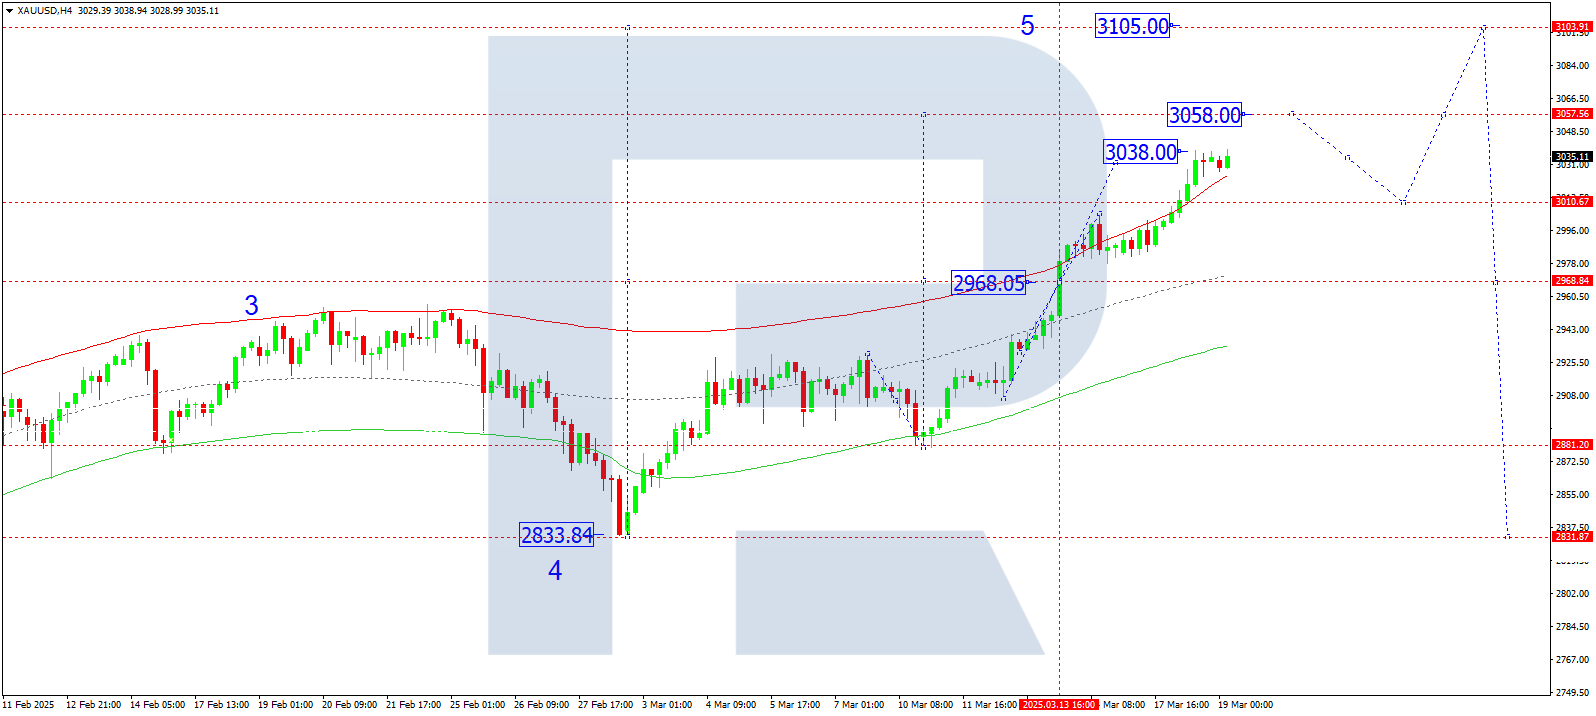
XAUUSD forecast
On the H4 chart of XAUUSD, the market completed a growth wave to 3,038. Today, 19 March 2025, a narrow consolidation range has formed below this level. If the price exits the range upwards, further growth to 3,058 is expected. After reaching this level, a correction to 3,010 may follow. If the price exits the range downward, a correction to 3,010 is likely. After this correction, growth towards 3,100 is expected.
Technically, this scenario is confirmed by the Elliott wave structure and the growth wave matrix with a pivot point at 2,945. This level is considered key for XAUUSD in this wave. The market is currently continuing its growth wave towards the upper boundary of the Price Envelope at 3,058. Later, a decline to the central line at 3,010 is expected.
Technical indicators for today’s XAUUSD forecast suggest a potential growth wave to 3,058.
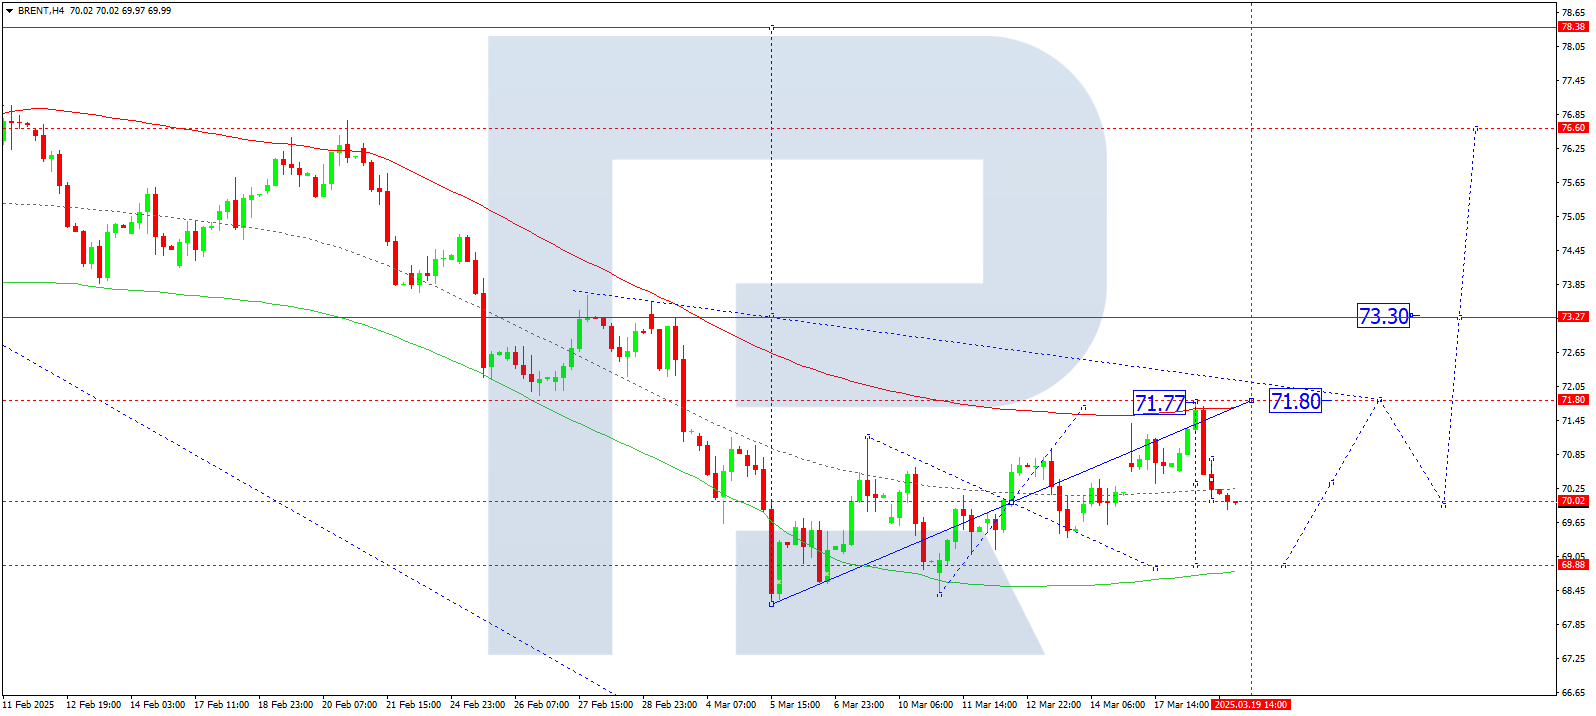
Brent forecast
On the H4 chart of Brent crude oil, the market completed a growth wave to 71.77. Today, 19 March 2025, a correction to 68.88 is expected. Once this correction is complete, another growth wave to 71.80 may develop, with a potential trend continuation to 73.30.
Technically, this scenario is confirmed by the Elliott wave structure and the growth wave matrix with a pivot point at 70.00, which is key for Brent. The market has recently completed a growth wave to the upper boundary of the Price Envelope at 71.77. A correction to the lower boundary at 68.88 is likely.
Technical indicators for today’s Brent forecast suggest a correction to 68.88.
Forecasts presented in this section only reflect the author’s private opinion and should not be considered as guidance for trading. RoboForex bears no responsibility for trading results based on trading recommendations described in these analytical reviews.