EURUSD, USDJPY, GBPUSD, AUDUSD, USDCAD, XAUUSD, and Brent technical analysis and forecast for 18 March 2025
Here is a detailed daily technical analysis and forecast for EURUSD, USDJPY, GBPUSD, AUDUSD, USDCAD, XAUUSD, and Brent for 18 March 2025.
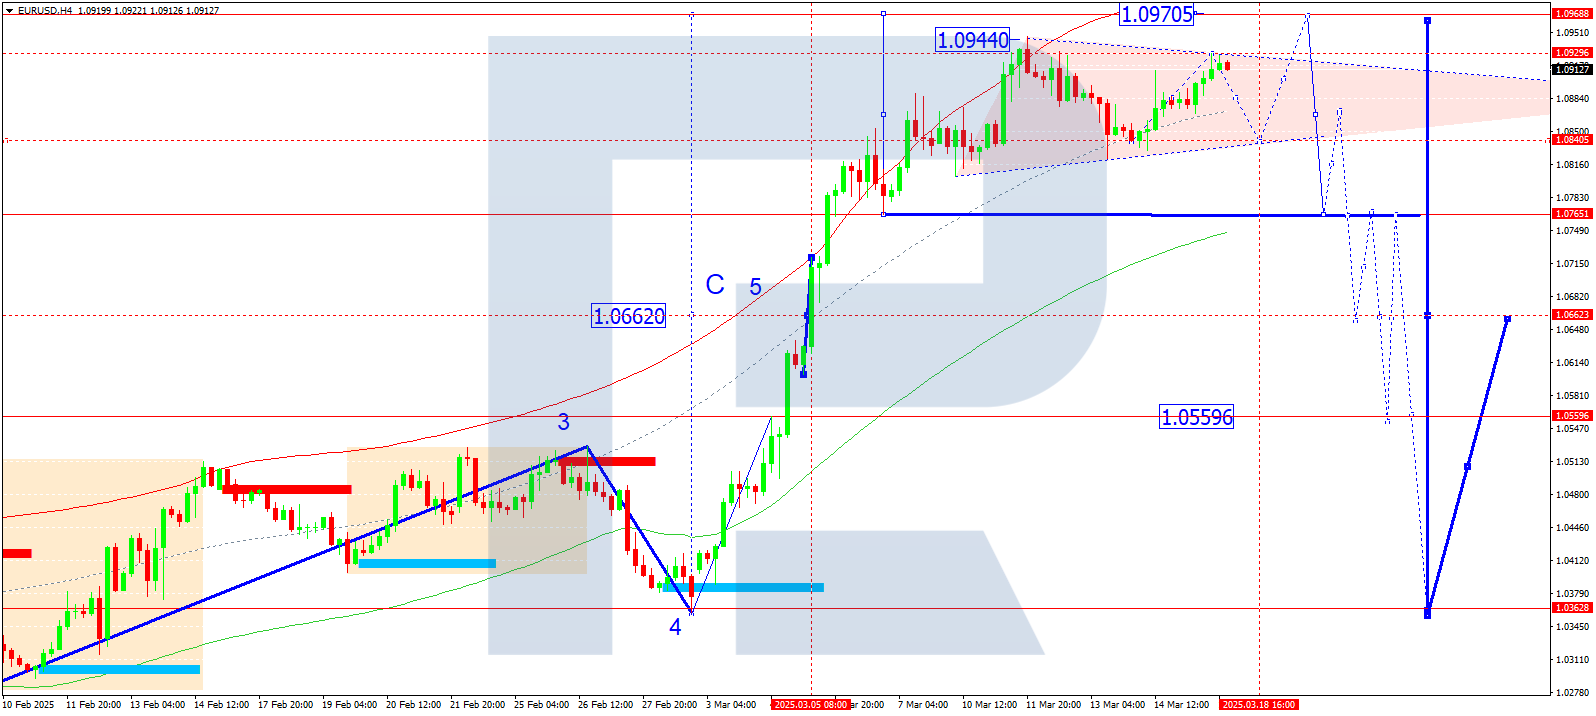
EURUSD forecast
On the H4 chart of EURUSD, the market continues to develop a consolidation range around the 1.0880 level without a clear trend. Today, 18 March 2025, the range expanded upwards to 1.0929. A correction to 1.0840 is possible next. After completing this correction, another growth wave structure may develop toward 1.0970.
Technically, this scenario is confirmed by the Elliott wave structure and the growth wave matrix with a pivot point at 1.0662, which is considered key for EURUSD. The market is currently forming a consolidation range around the central line of the price Envelope at 1.0880. The range has recently expanded upwards to 1.0929. A correction and expansion downward to 1.0840 should be considered. If the range breaks upwards, the growth wave may continue to the upper boundary of the Envelope at 1.0970. If it breaks downward, a correction toward the lower boundary at 1.0765 will be analyzed.
Technical indicators for today’s EURUSD forecast suggest a possible correction to 1.0840.
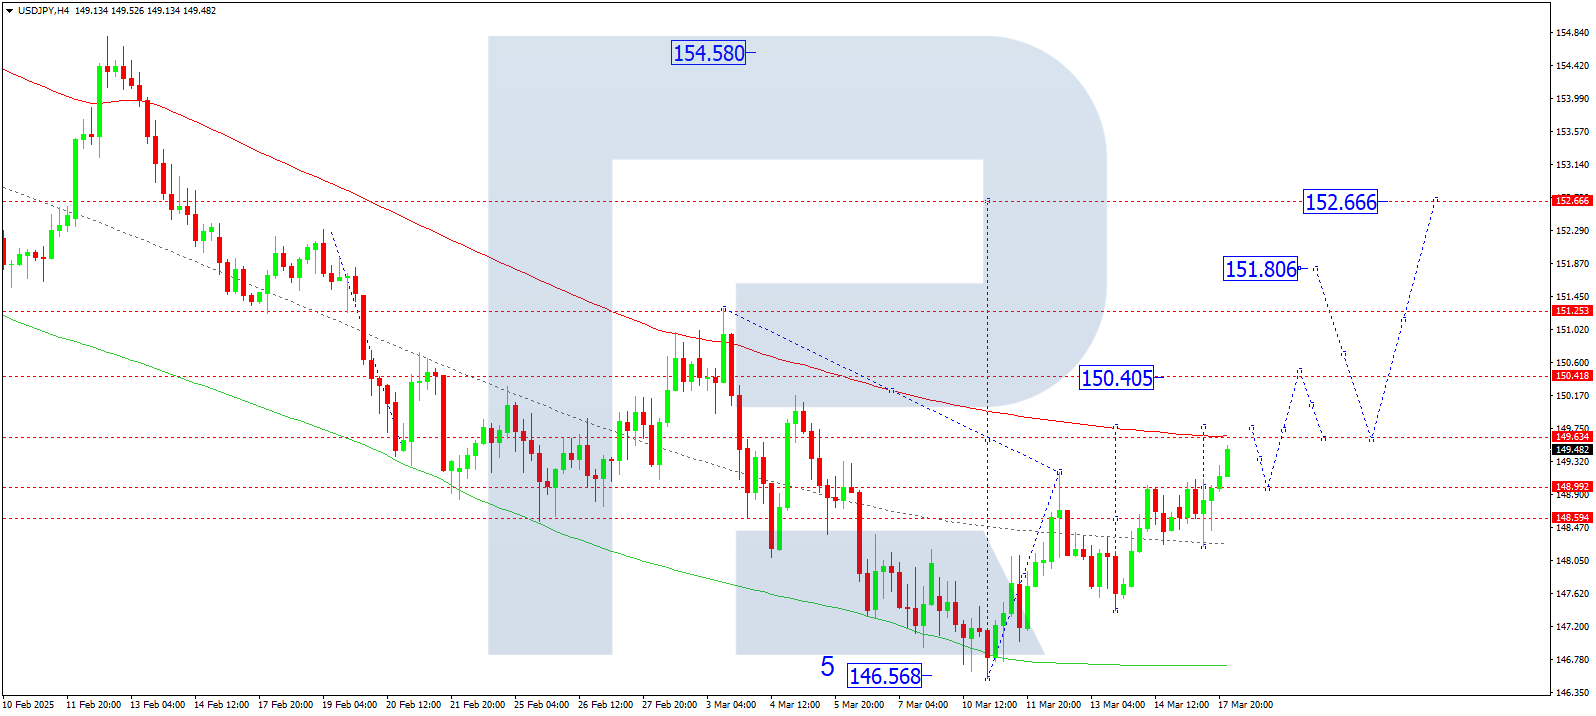
USDJPY forecast
On the H4 chart of USDJPY, the market is forming a growth wave structure toward 149.77. Today, 18 March 2025, we expect this level to be reached. If it breaks upwards, the wave may extend to 150.40, with a potential continuation toward 151.80. This is a local target. After reaching it, a correction back to 149.77 cannot be ruled out.
Technically, this scenario is supported by the Elliott wave structure and the growth wave matrix with a pivot point at 149.77. Currently, the market is forming a growth structure toward the upper boundary of the price Envelope at 150.40. If this level is reached, a correction to the central line at 148.90 is possible. Later, the trend may continue toward the upper boundary of the Envelope at 151.80.
Technical indicators for today’s USDJPY forecast suggest a growth wave to 149.77 and 150.40.
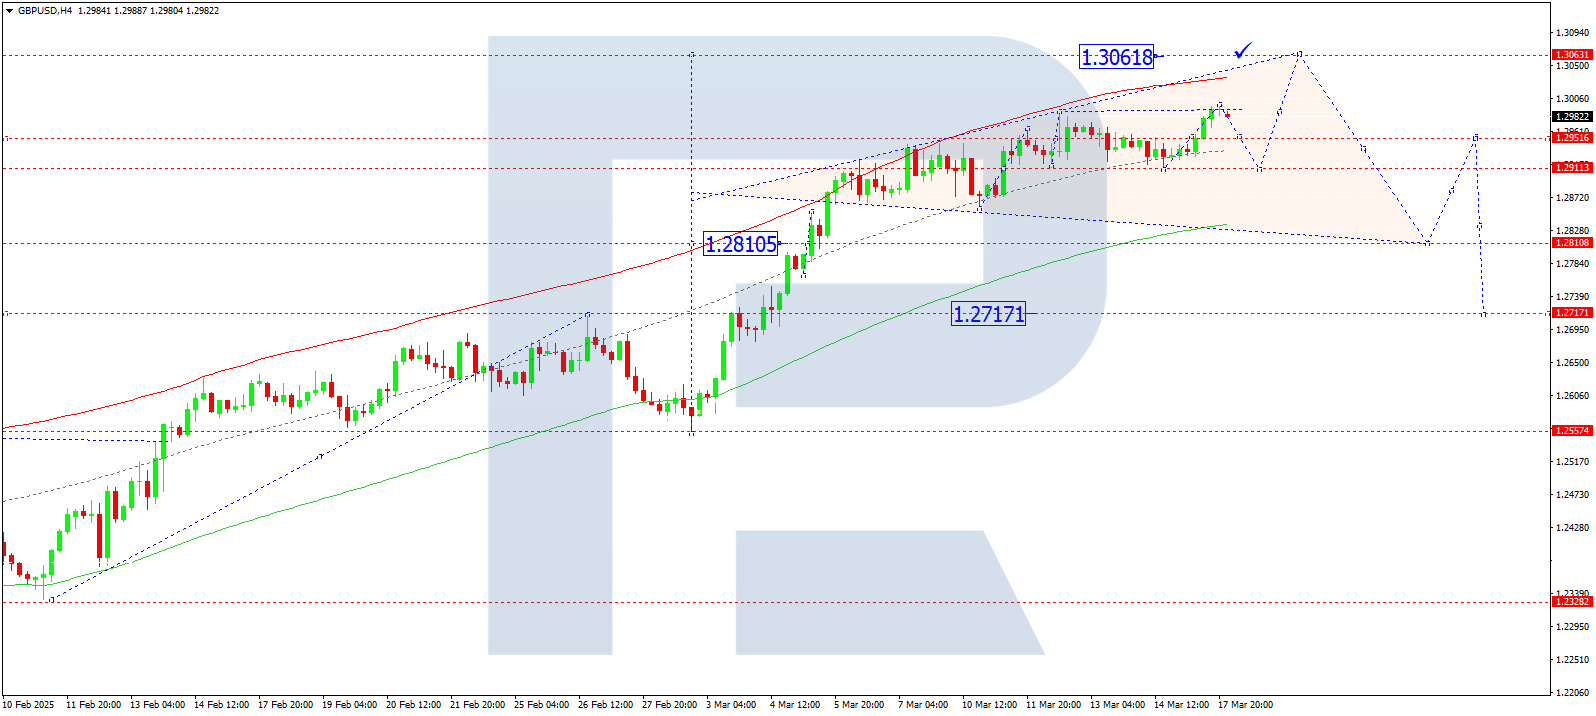
GBPUSD forecast
On the H4 chart of GBPUSD, the market continues to develop a consolidation range around 1.2950. It has temporarily expanded upwards to 1.2998. Today, 18 March 2025, a downward expansion to 1.2910 cannot be ruled out. If the range breaks upwards, the growth wave may continue to 1.3062. If it breaks downward, a decline toward 1.2810 may develop.
Technically, this scenario is supported by the Elliott wave structure and the growth wave matrix with a pivot point at 1.2810. Currently, the market has completed a growth wave to the upper boundary of the price Envelope at 1.2998. A downward wave toward its lower boundary at 1.2810 is expected.
Technical indicators for today’s GBPUSD forecast suggest the beginning of a decline to 1.2810.
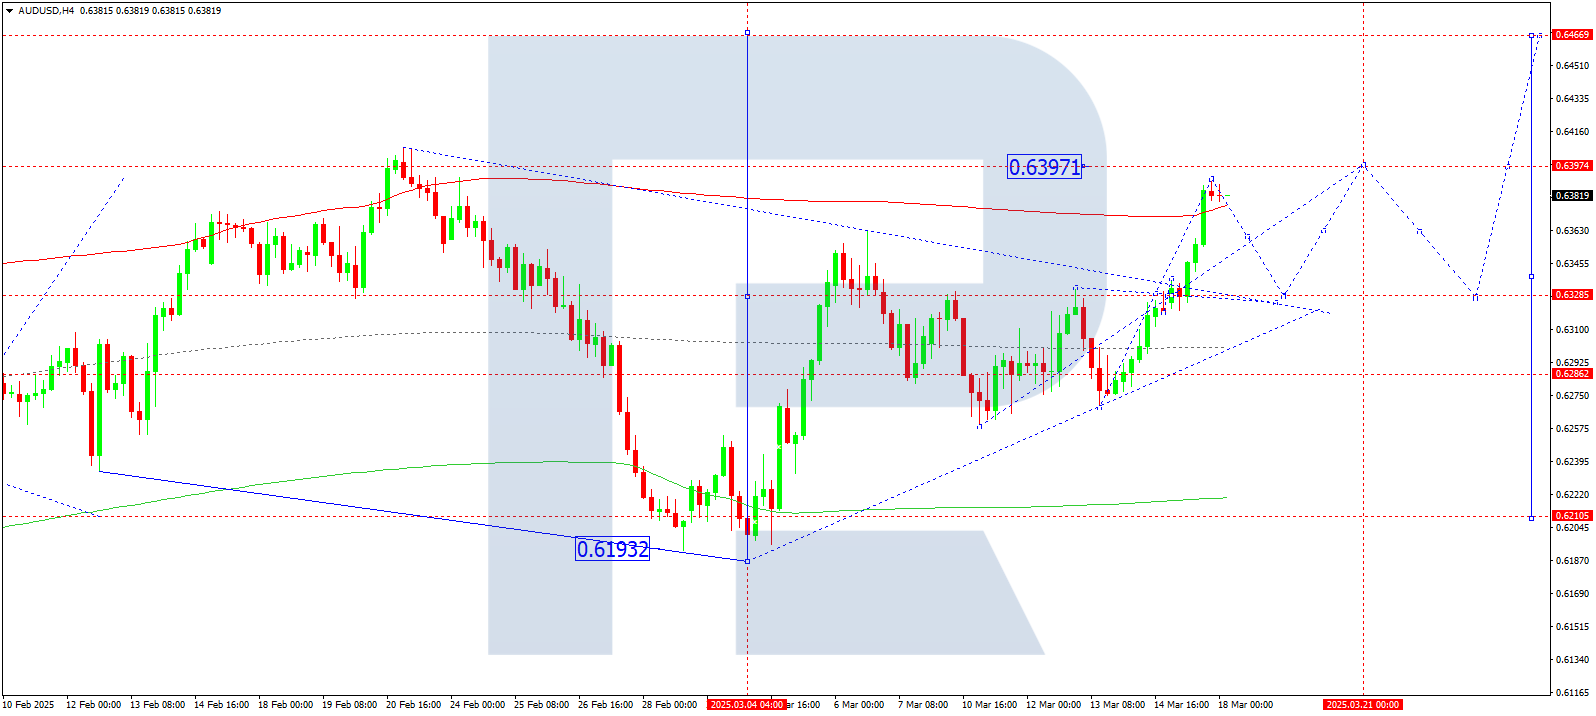
AUDUSD forecast
On the H4 chart of AUDUSD, the market has formed a compact consolidation range around 0.6328 and, after breaking upwards, is developing a growth wave toward 0.6397. Today, 18 March 2025, the local target of this wave at 0.6390 has been reached. Next, a correction to 0.6328 is likely. After this correction, a new growth wave to 0.6397 may develop, with the trend potentially continuing to 0.6444.
Technically, this scenario is supported by the Elliott wave structure and the growth wave matrix for AUDUSD with a pivot point at 0.6328. Currently, a growth structure is forming toward the upper boundary of the price Envelope at 0.6397. A subsequent correction toward the central line at 0.6328 should be considered.
Technical indicators for today’s AUDUSD forecast suggest a correction to 0.6328.
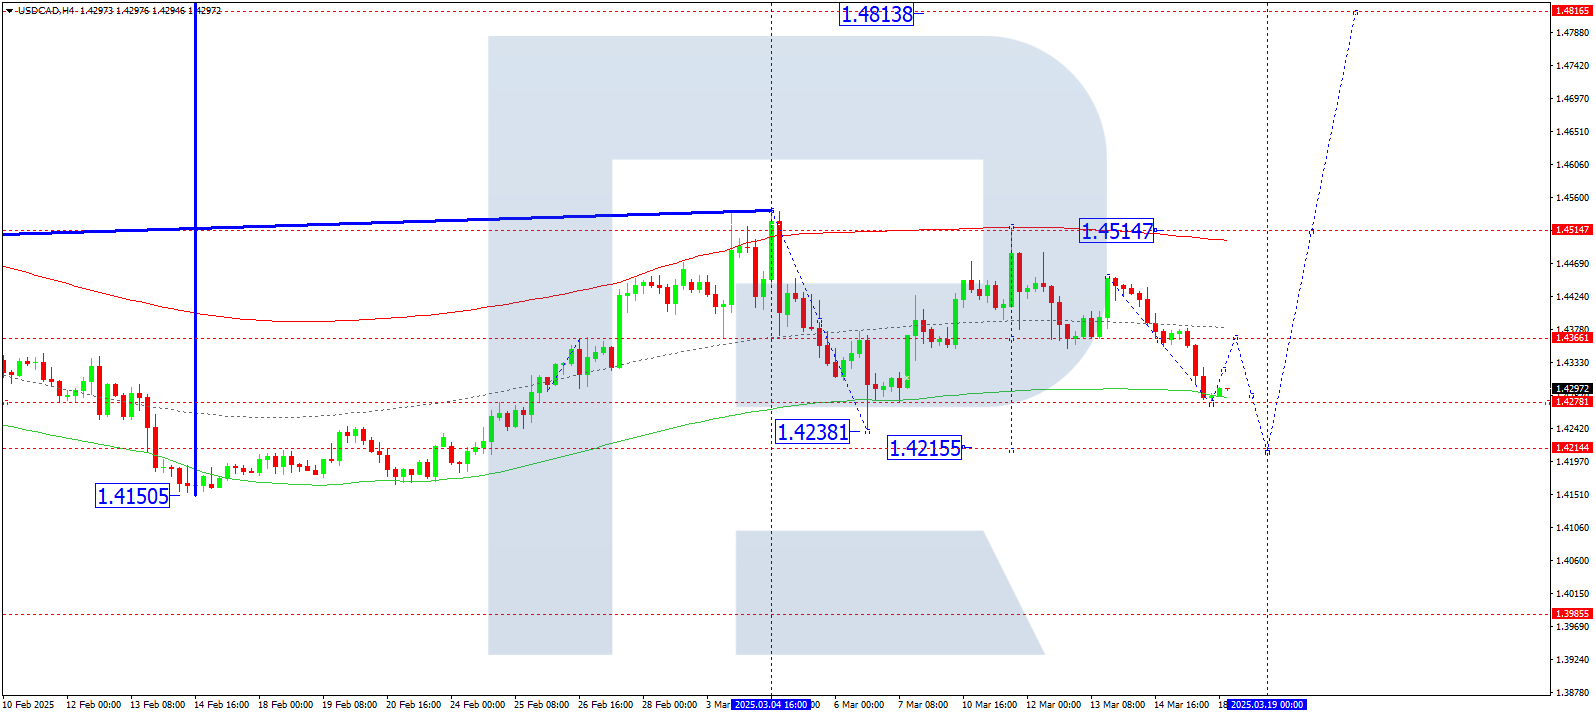
USDCAD forecast
On the H4 chart of USDCAD, the market continues to develop a consolidation range around 1.4366. Today, 18 March 2025, the range expanded downward to 1.4278. A growth wave toward 1.4366 (test from below) is expected next. After that, a decline toward 1.4215 may develop.
Technically, this scenario is supported by the Elliott wave structure and the downward wave matrix with a pivot point at 1.4366. This level is considered key for USDCAD in this wave structure. Currently, the market has completed a downward wave to the lower boundary of the price Envelope at 1.4278. A new growth wave toward the central line of the Envelope at 1.4366 is likely.
Technical indicators for today’s USDCAD forecast suggest a growth wave to 1.4366.
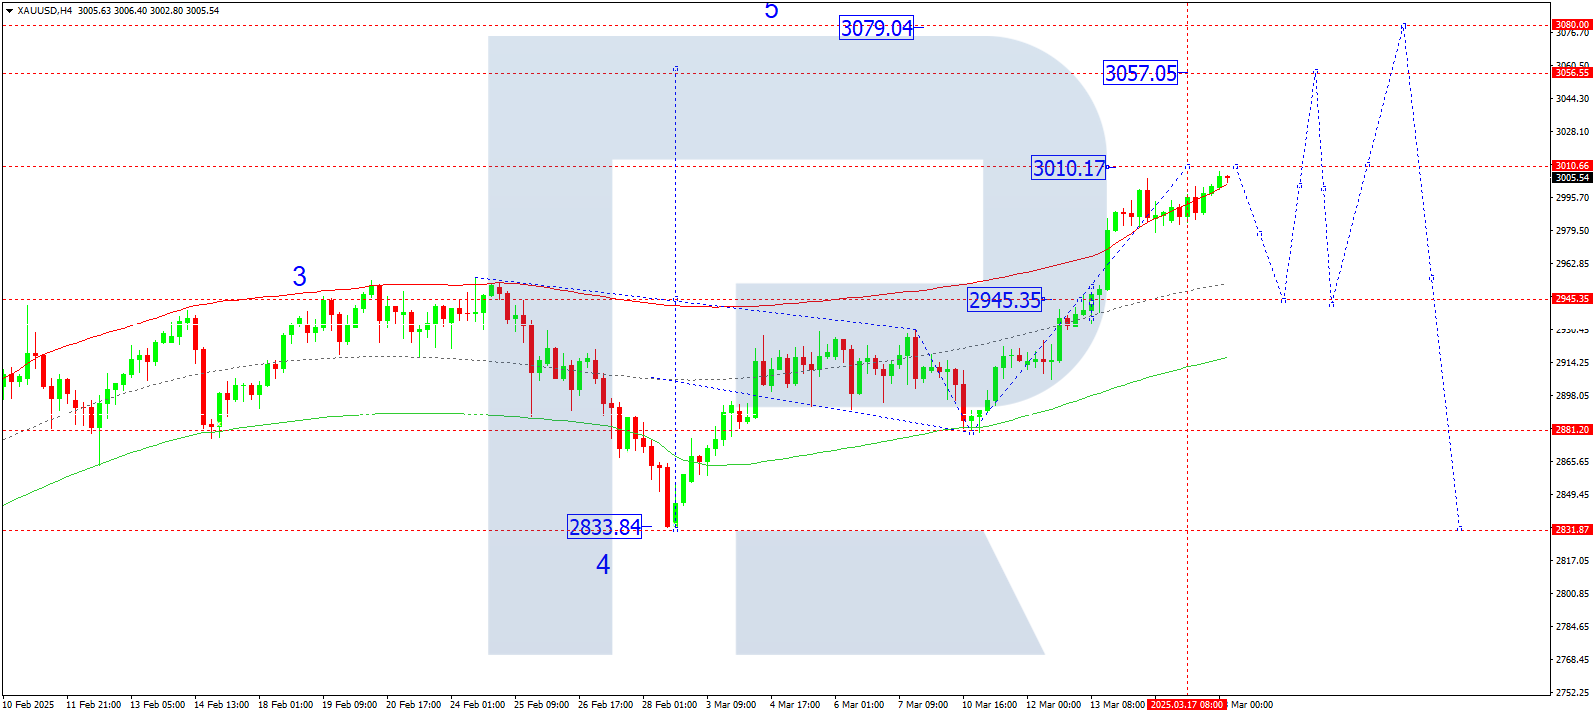
XAUUSD forecast
On the H4 chart of XAUUSD, the market continues a growth wave toward 3,010, which is a local target. Today, 18 March 2025, we expect this level to be reached. After that, a correction to 2,945 may develop. Once this correction is complete, a new growth wave toward 3,057 could begin.
Technically, this scenario is supported by the Elliott wave structure and the growth wave matrix with a pivot point at 2,945. This level is considered key for XAUUSD in this wave. Currently, the market has completed a growth wave to the upper boundary of the price Envelope at 3,010. A downward correction toward the central line at 2,945 is expected.
Technical indicators for today’s XAUUSD forecast suggest a correction to 2,945.
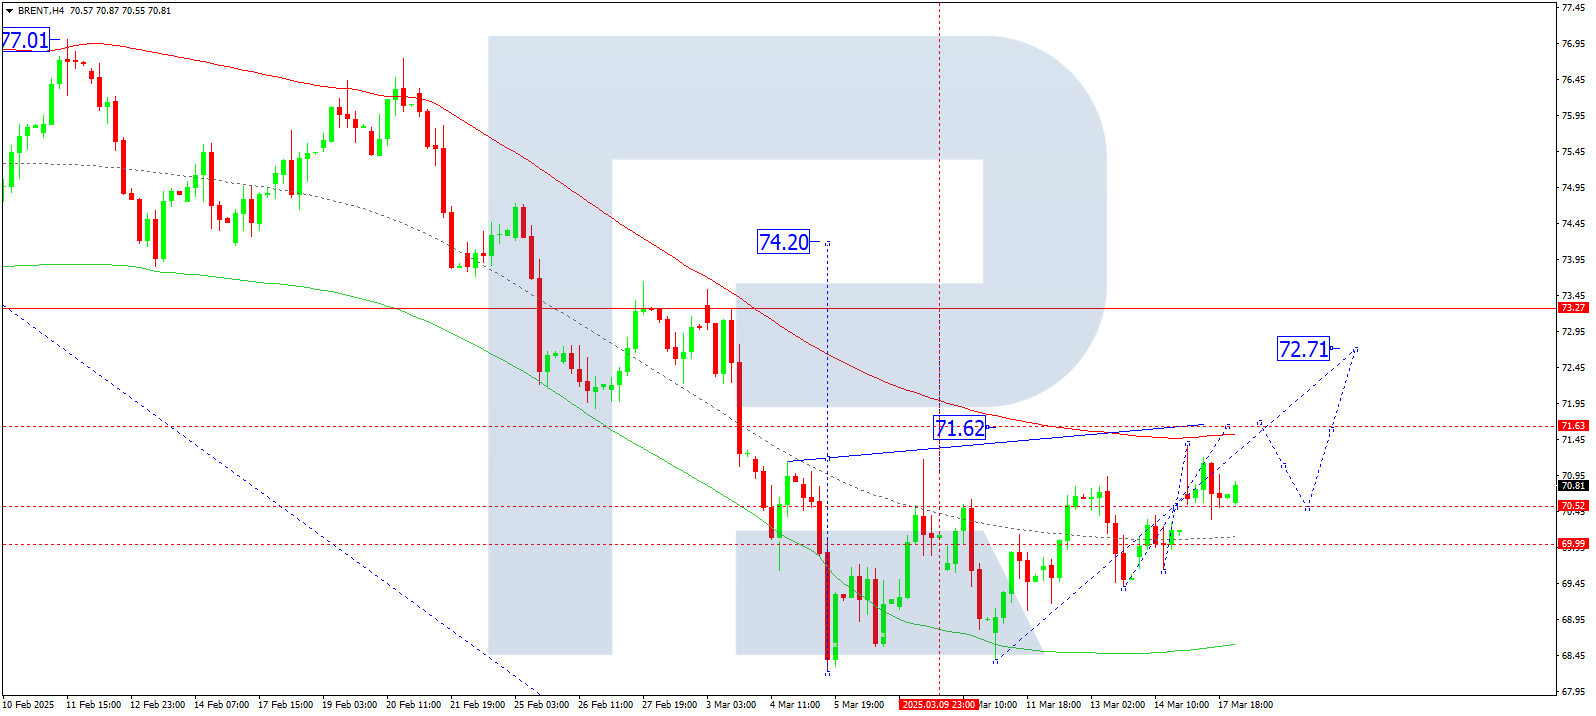
Brent forecast
On the H4 chart of Brent crude oil, the market is forming a consolidation range around 70.55. Today, 18 March 2025, a growth wave toward 71.60 is expected. After that, a correction to 70.55 may develop. Later, the growth wave may continue to 72.72, with a potential extension to 73.30 as the first target.
Technically, this scenario is supported by the Elliott wave structure and the growth wave matrix with a pivot point at 70.55, which is key for Brent. Currently, the market is consolidating around the central line of the price Envelope at 70.55. A growth wave toward the upper boundary at 71.60 is expected.
Technical indicators for today’s Brent forecast suggest a growth wave to 71.60.
Forecasts presented in this section only reflect the author’s private opinion and should not be considered as guidance for trading. RoboForex bears no responsibility for trading results based on trading recommendations described in these analytical reviews.