World indices overview: news from US 30, US 500, US Tech, JP 225, and DE 40 for 27 March 2025
The decision to impose new US tariffs sent down all global stock indices. Find out more in our analysis and forecast for global indices for 27 March 2025.
US indices forecast: US 30, US 500, US Tech
- Recent data: US durable goods orders rose by 0.9% in February
- Market impact: a better-than-forecast reading typically indicates healthier economic activity, which may support stock growth
Fundamental analysis
The positive reading of 0.9% shows that the volume of orders is growing, with the result exceeding the forecast of -1.1%. This is an indicator of industrial production and the health of the US manufacturing industry. A stronger-than-expected reading typically points to healthier economic activity, which could support stocks.
However, the threat of new US tariffs on other countries is weighing on the market. The authorities are introducing fees of 3.5 million USD per US port call for Chinese vessels. This measure is aimed to boost the US shipbuilding industry, with duties potentially bringing in from 40 to 52 billion USD a year, according to Clarksons Research Services. All this could trigger a new round of inflation growth, which will not allow the US Federal Reserve to lower interest rates.
US 30 technical analysis
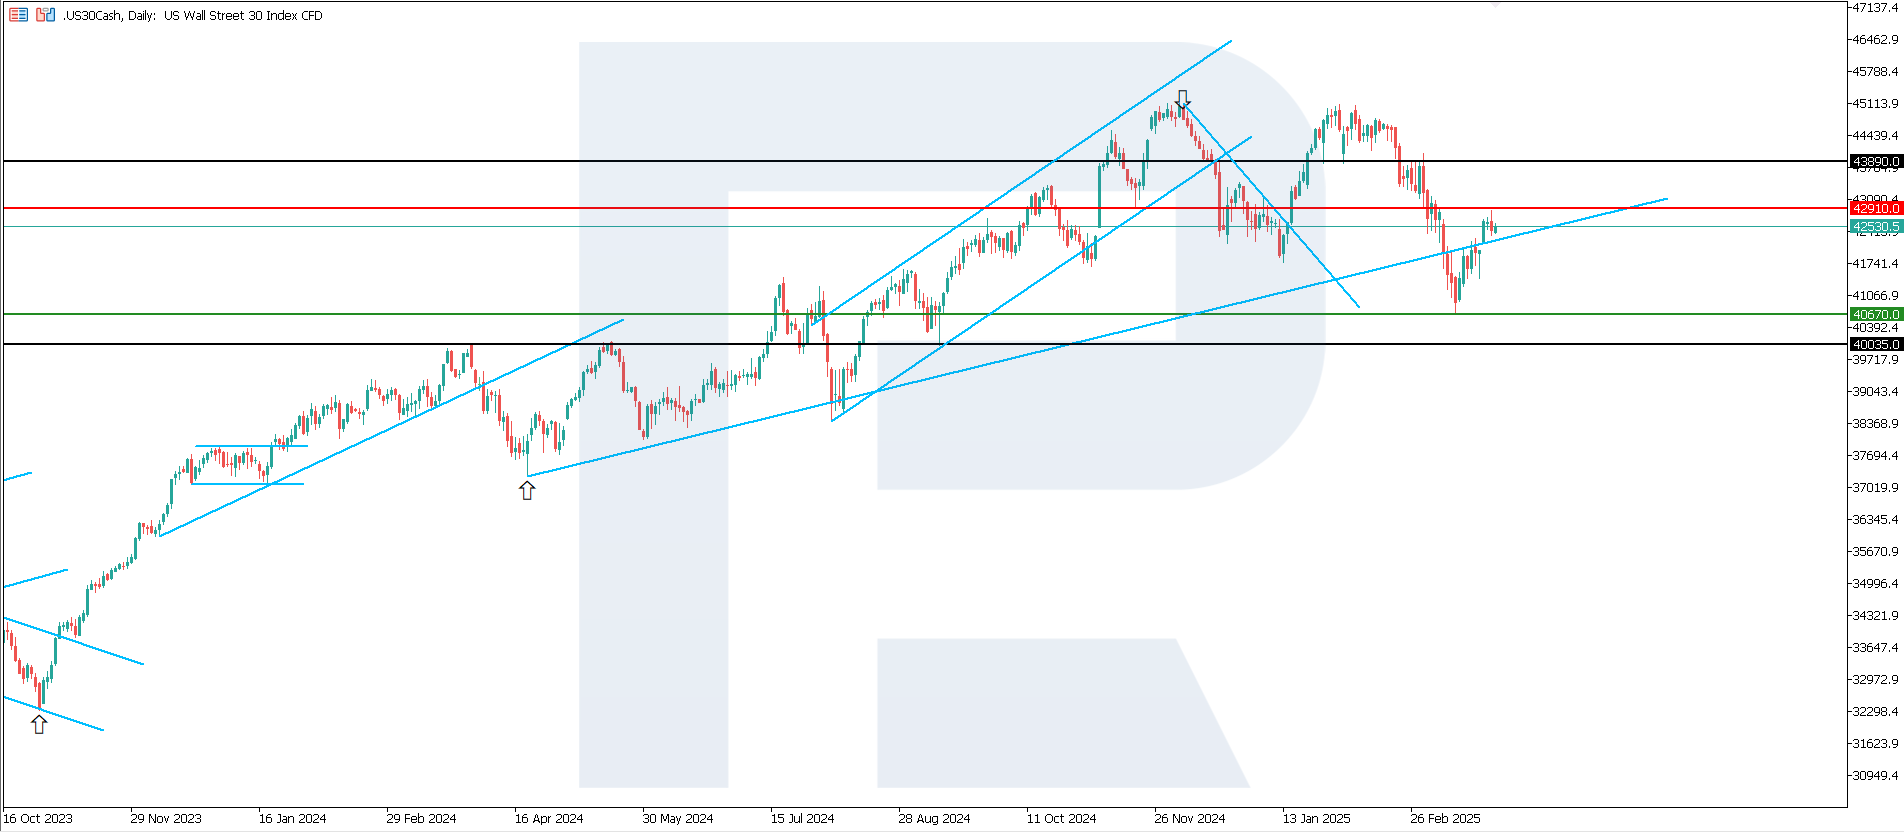
Following the correction, the US 30 stock index began to decline again without reaching the 42,910.0 resistance level. The downtrend continues, with the price highly likely to fall further in an effort to reach a new six-month low.
The following scenarios are considered for the US 30 price forecast:
- Pessimistic US 30 forecast: after the price consolidates below the previously breached support level at 42,370.0, the index could plunge to 40,035.0
- Optimistic US 30 forecast: a breakout above the 42,910.0 resistance level could drive the index to 43,890.0
US 500 technical analysis
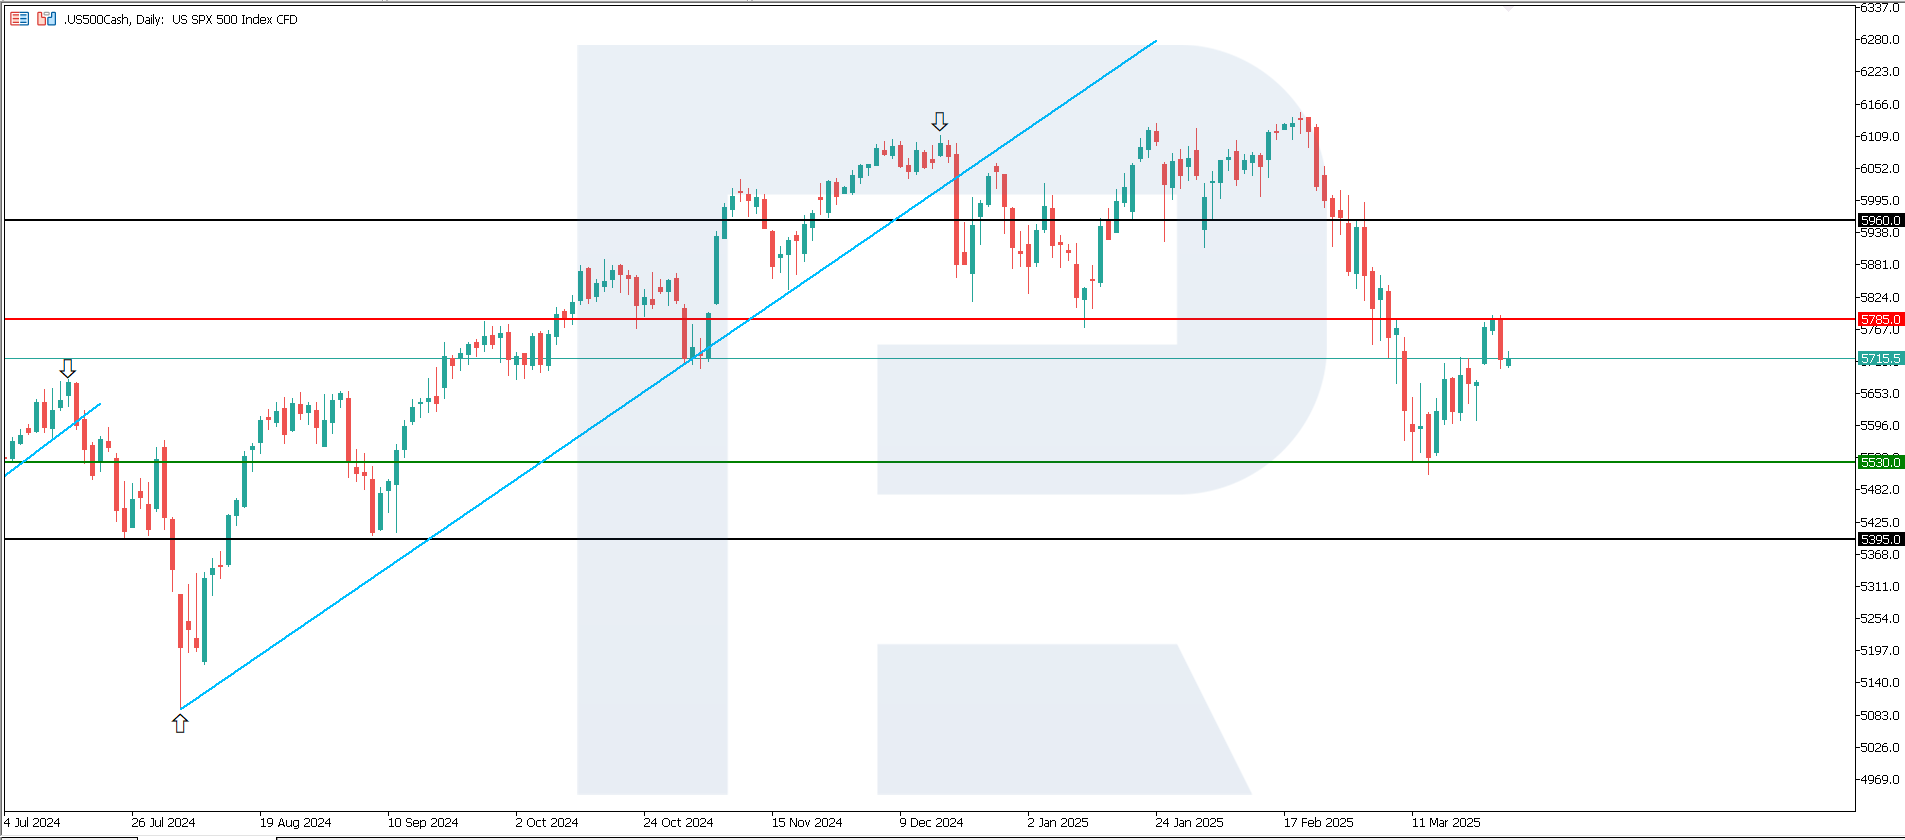
The US 500 stock index has rebounded from the 5,785.0 resistance level and will likely continue to fall in the medium term. Upward momentum is insufficient for a trend reversal.
The following scenarios are considered for the US 500 price forecast:
- Pessimistic US 500 forecast: a breakout below the 5,530.0 support level could push the index down to 5,395.0
- Optimistic US 500 forecast: a breakout above the 5,785.0 resistance level could propel the index to 5,960.0
US Tech technical analysis
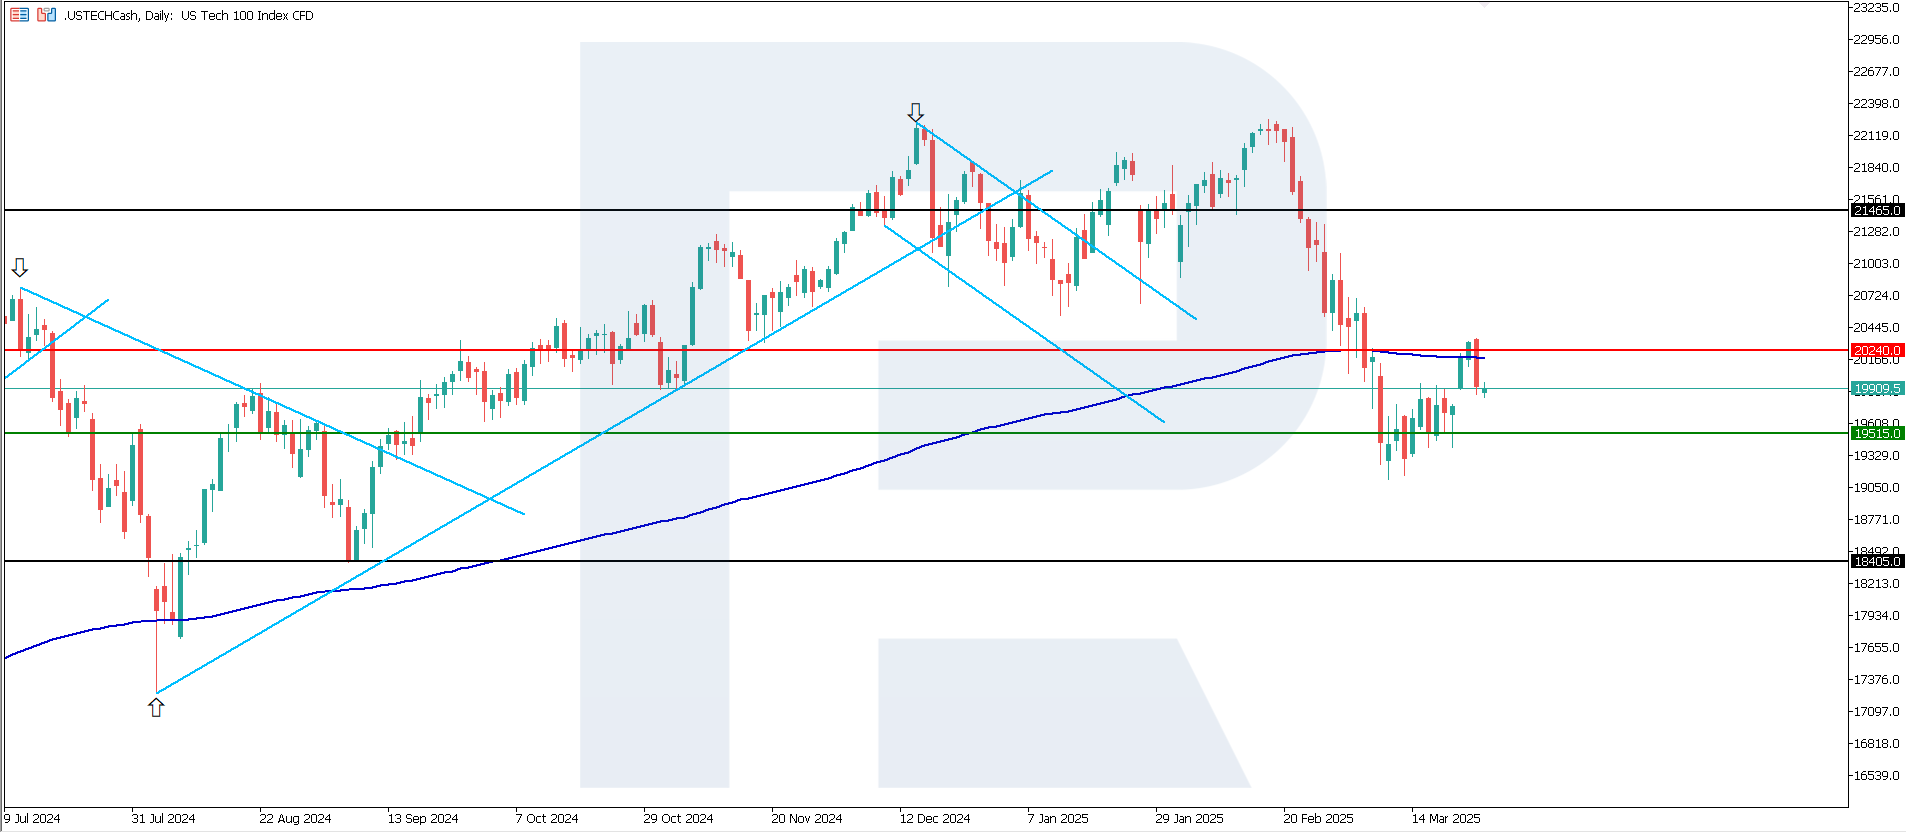
The US Tech index broke above the 20,240.0 resistance level and returned above the 200-day Moving Average. However, the index soon retraced below this level, forming a False Breakout pattern. The support level shifted to 19,515.0, which the price will likely breach, aiming for 18,405.0.
The following scenarios are considered for the US Tech price forecast:
- Pessimistic US Tech forecast: a breakout below the 19,515.0 support level could send the index down to 18,405.0
- Optimistic US Tech forecast: if the price consolidates above the previously breached resistance level at 20,240.0, the index could rise to 21,465.0
Asian index forecast: JP 225
- Recent data: Japan’s two-year government bond yields reached 0.88%
- Market impact: high rates make bonds more attractive than risky assets
Fundamental analysis
Rising rates make bonds more appealing than risky assets, which may lead to capital outflow from the stock market. So far, the Bank of Japan has pursued an extremely low interest rate (nearly zero interest rate) policy. If bond yields continue to increase, this could mean that the era of cheap money in Japan is coming to an end, and the central bank is poised for further rate hikes.
Overall, the Japanese stock market may face increased volatility and capital reallocation towards safer assets and the financial sector if interest rate expectations continue to rise.
JP 225 technical analysis
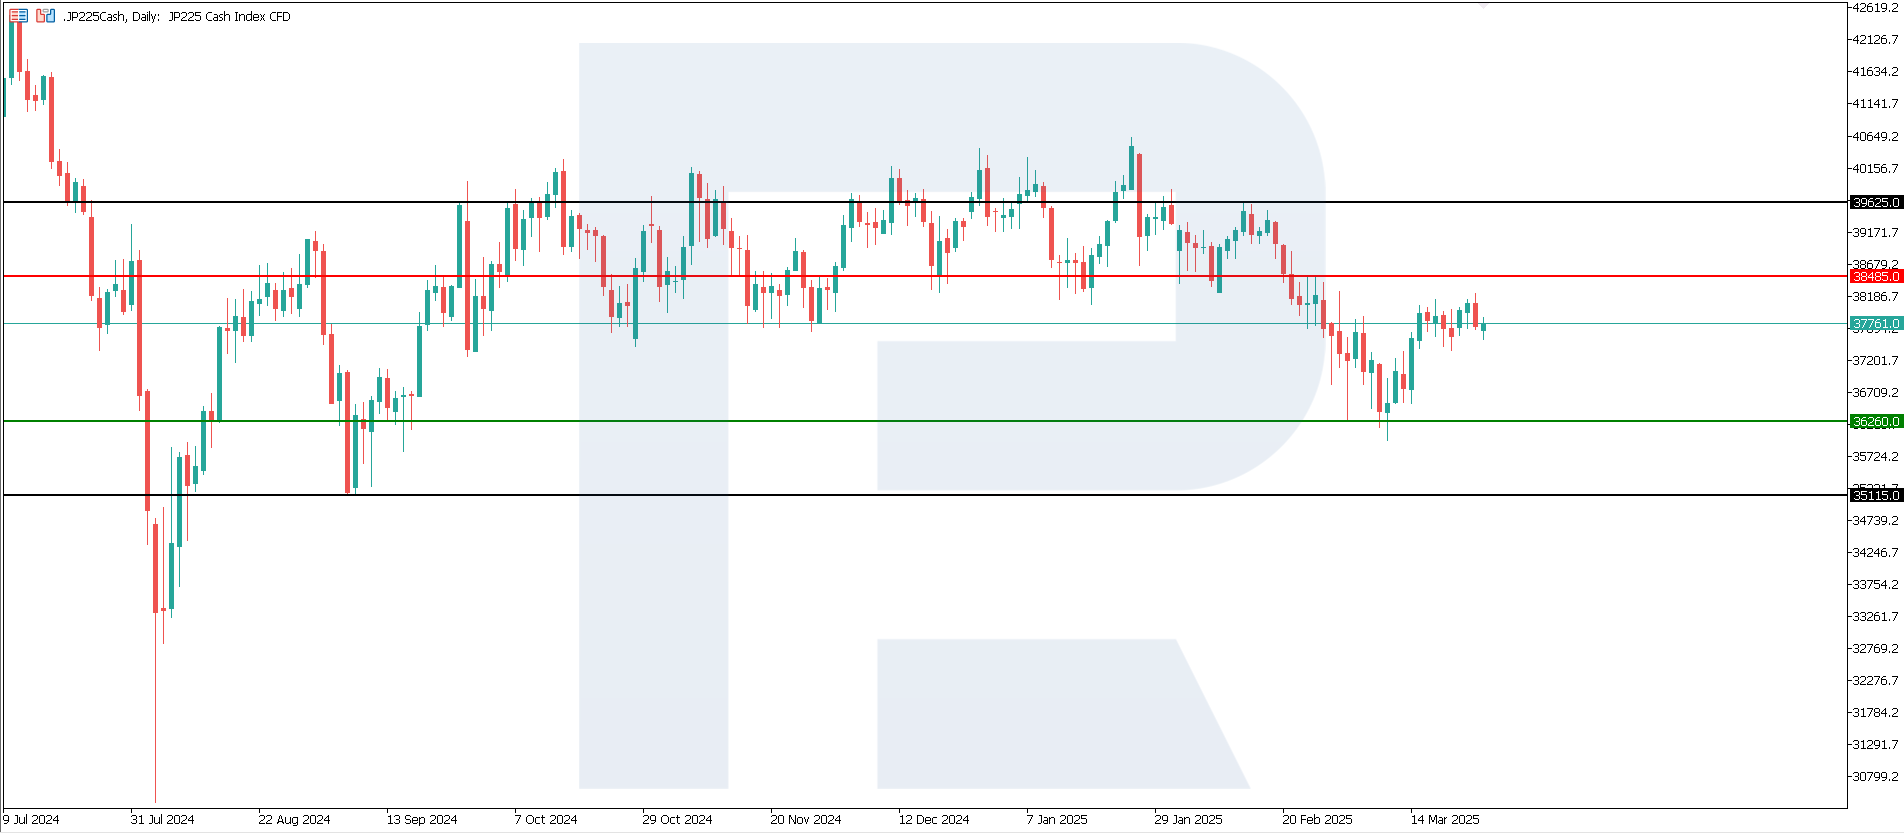
The stock index climbed by over 5% from the previously recorded six-month low, with the price currently approaching the 38,485.0 resistance level. If this level does not break, a consolidation or transition to a sideways movement is likely. However, in case of a breakout below the 36,260.0 support level, the downtrend could strengthen and become the main one.
The following scenarios are considered for the JP 225 price forecast:
- Pessimistic JP 225 forecast: a breakout below the 36,260.0 support level could push the index down to 35,115.0
- Optimistic JP 225 forecast: a breakout above the 38,485.0 resistance level could propel the index to 39,625.0
European index forecast: DE 40
- Recent data: Germany’s ifo Business Climate Index was 86.7 points in February
- Market impact: investors are typically positive about a rise in the index above the previous reading
Fundamental analysis
Stabilising or improving business sentiment may prompt investors to buy shares in industrial, construction or consumer sector companies that benefit from growing domestic demand. Overall, a slightly higher ifo reading than before indicates some recovery in business sentiment, which could support the German stock market, especially in sectors sensitive to domestic demand.
The US authorities intend to impose 25% tariffs on foreign cars, with Germany becoming one of the main victims. Automakers’ stocks will come under pressure.
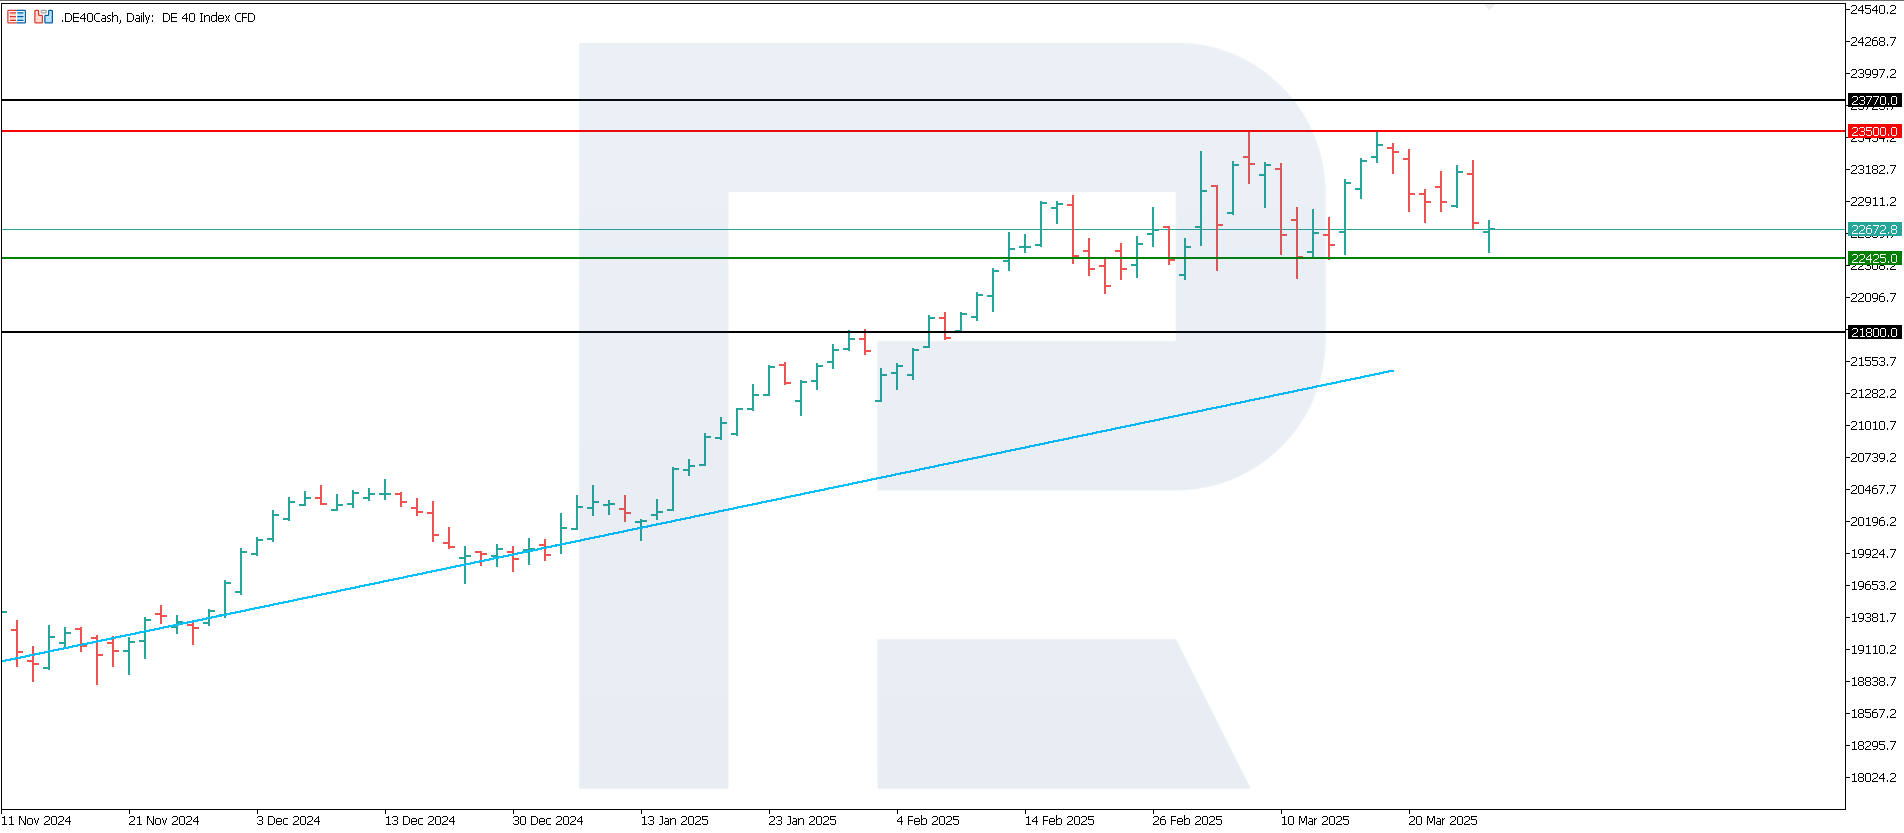
DE 40 technical analysis
The DE 40 stock index rebounded from the 23,500.0 resistance level, without reaching a new all-time high. A sideways channel could form or the trend could reverse in case of a breakout below the support level. The uptrend is not expected to continue in the short term.
The following scenarios are considered for the DE 40 price forecast:
- Pessimistic DE 40 forecast: a breakout below the 22,425.0 support level could send the index down to 21,800.0
- Optimistic DE 40 forecast: a breakout above the 23,500.0 resistance level could drive the index to 23,770.0
Summary
The main news was the introduction of US import tariffs on cars, marking another phase of the trade war, which could lead to a rise in global inflation. The latter jeopardises the prospects of monetary policy easing. The US indices continue to fall, while the Japanese JP 225 may enter a sideways channel. The German DE 40 remains in an uptrend, but the likelihood of a correction is increasing.
Forecasts presented in this section only reflect the author’s private opinion and should not be considered as guidance for trading. RoboForex bears no responsibility for trading results based on trading recommendations described in these analytical reviews.