World indices overview: news from US 30, US 500, US Tech, JP 225, and DE 40 for 4 March 2025
Global indices plummeted after US President Donald Trump's decision to approve tariffs on Canada, China, and Mexico. Find out more in our analysis and forecast for global indices for 4 March 2025.
US indices forecast: US 30, US 500, US Tech
- Recent data: the US ISM manufacturing PMI came in at 50.3 points in February
- Market impact: this is usually moderately negative news for the US stock market
Fundamental analysis
The decline in the ISM manufacturing PMI from 50.9 to 50.3 indicates that the manufacturing sector continues to expand, but the pace of growth is slowing. However, the main trigger in the stock market remains the news about an increase in tariffs.
Goldman Sachs economists forecast that Trump’s tariffs of 25% on imports from Canada and Mexico and 10% on Canadian energy resources will push up core consumer prices in the US by 0.6%.
US 30 technical analysis
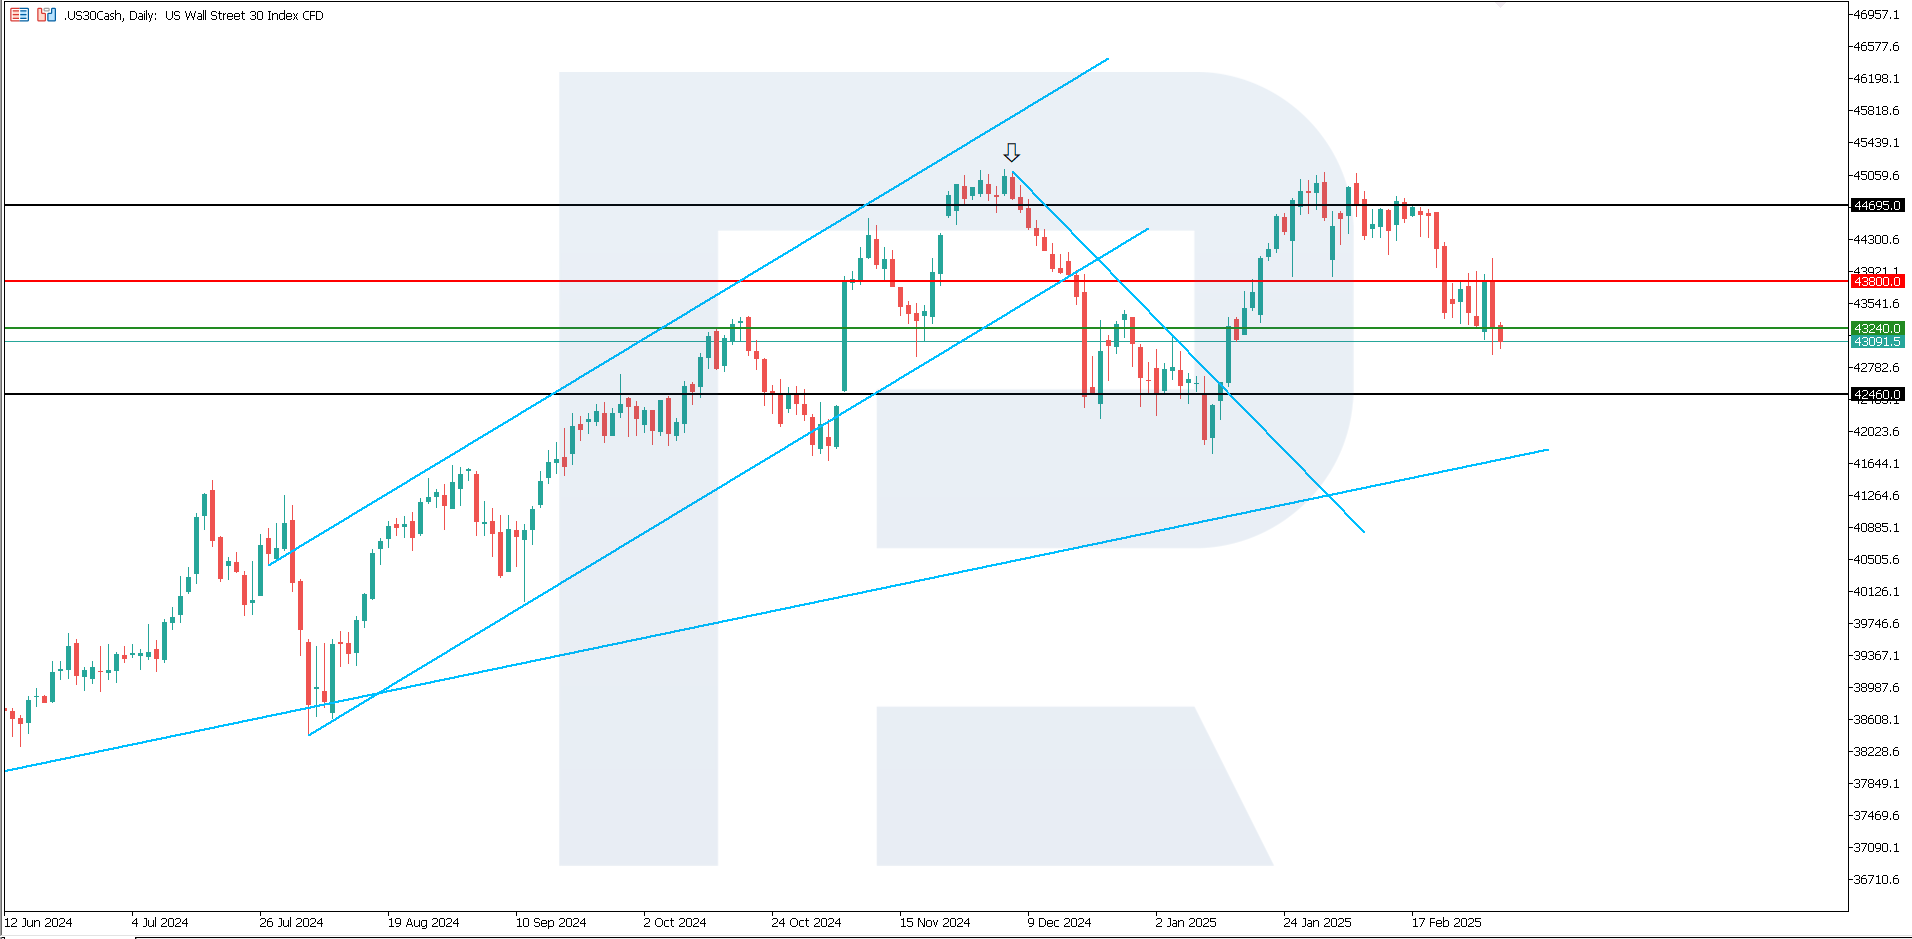
The US 30 stock index continues to decline. The downtrend is becoming medium-term. However, according to the US 30 technical analysis, a sideways range could form before the index tumbles further.
The following scenarios are considered for the US 30 price forecast:
- Pessimistic US 30 forecast: a breakout below the 43,240.0 support level could push the index down to 42,460.0
- Optimistic US 30 forecast: a breakout above the 43,800.0 resistance level could drive the index to 44,695.0
US 500 technical analysis
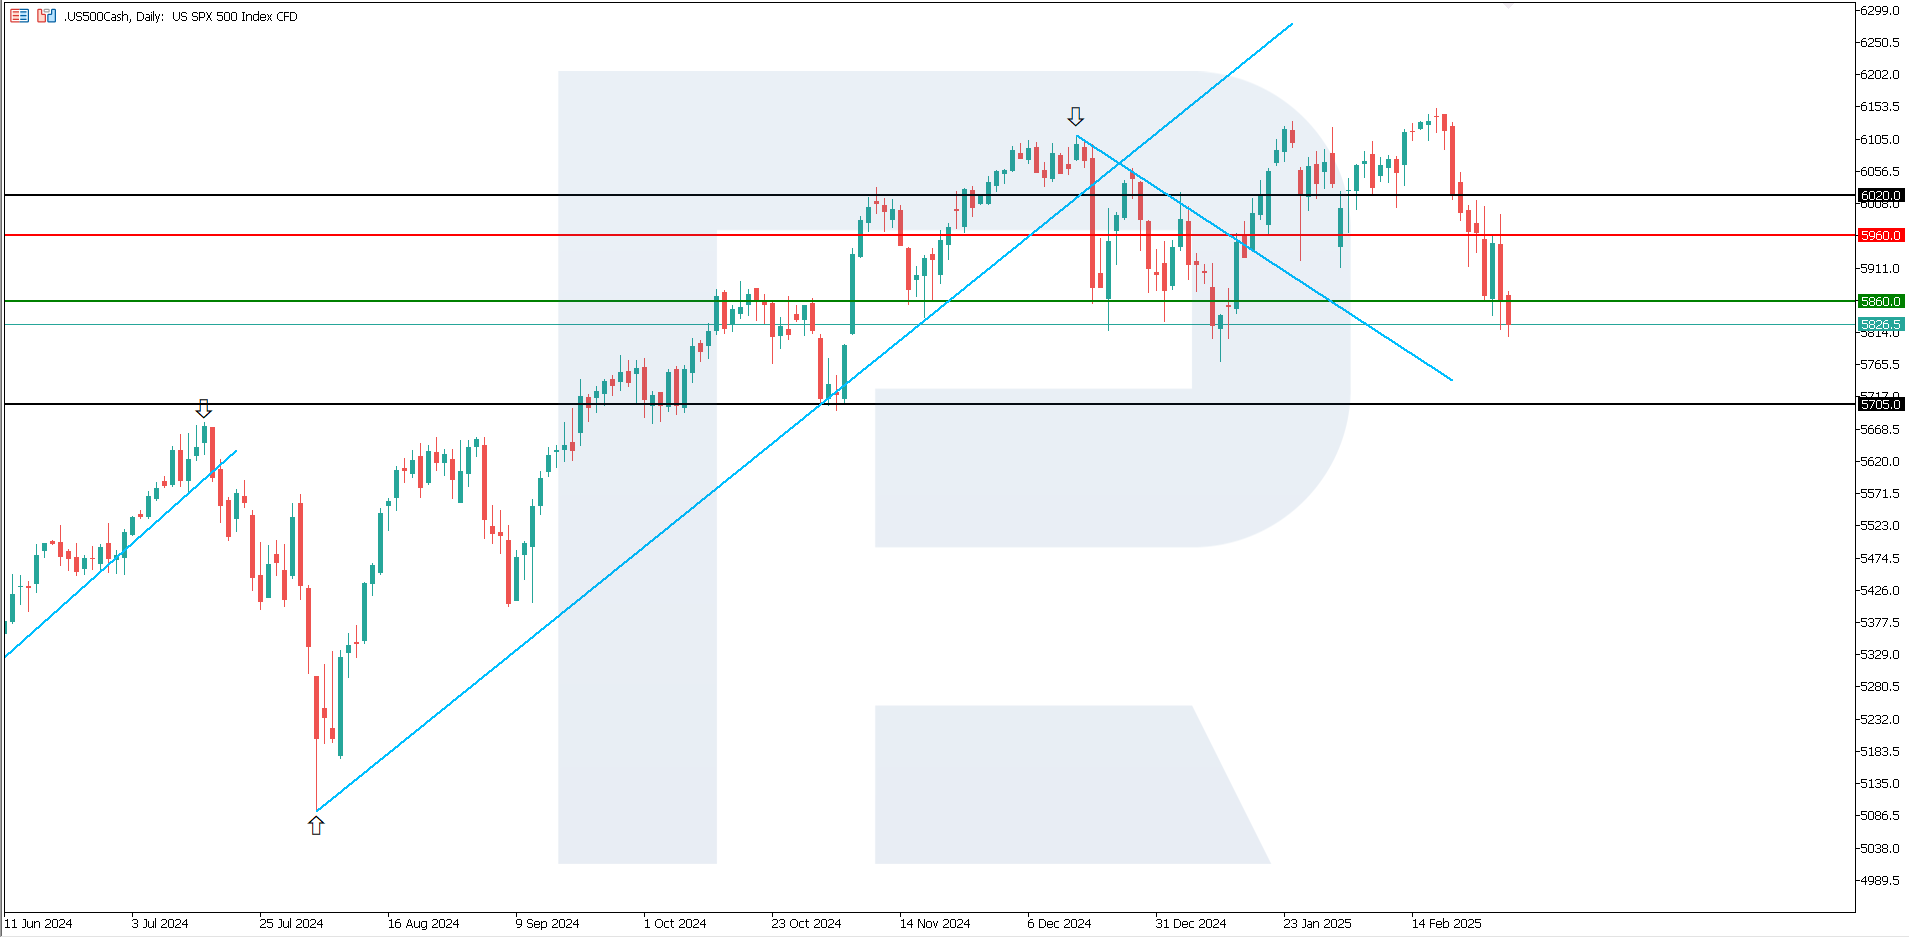
The US 500 stock index dropped by over 5% from the peak it hit on 19 February, marking the most significant pullback since August last year. This is the thirtieth correction of over 5% from the high since the March 2009 decline. The US 500 technical analysis suggests that the downtrend could continue.
The following scenarios are considered for the US 500 price forecast:
- Pessimistic US 500 forecast: a breakout below the 5,860.0 support level could send the index down to 5,705.0
- Optimistic US 500 forecast: a breakout above the 5,960.0 resistance level could propel the index to 6,020.0
US Tech technical analysis
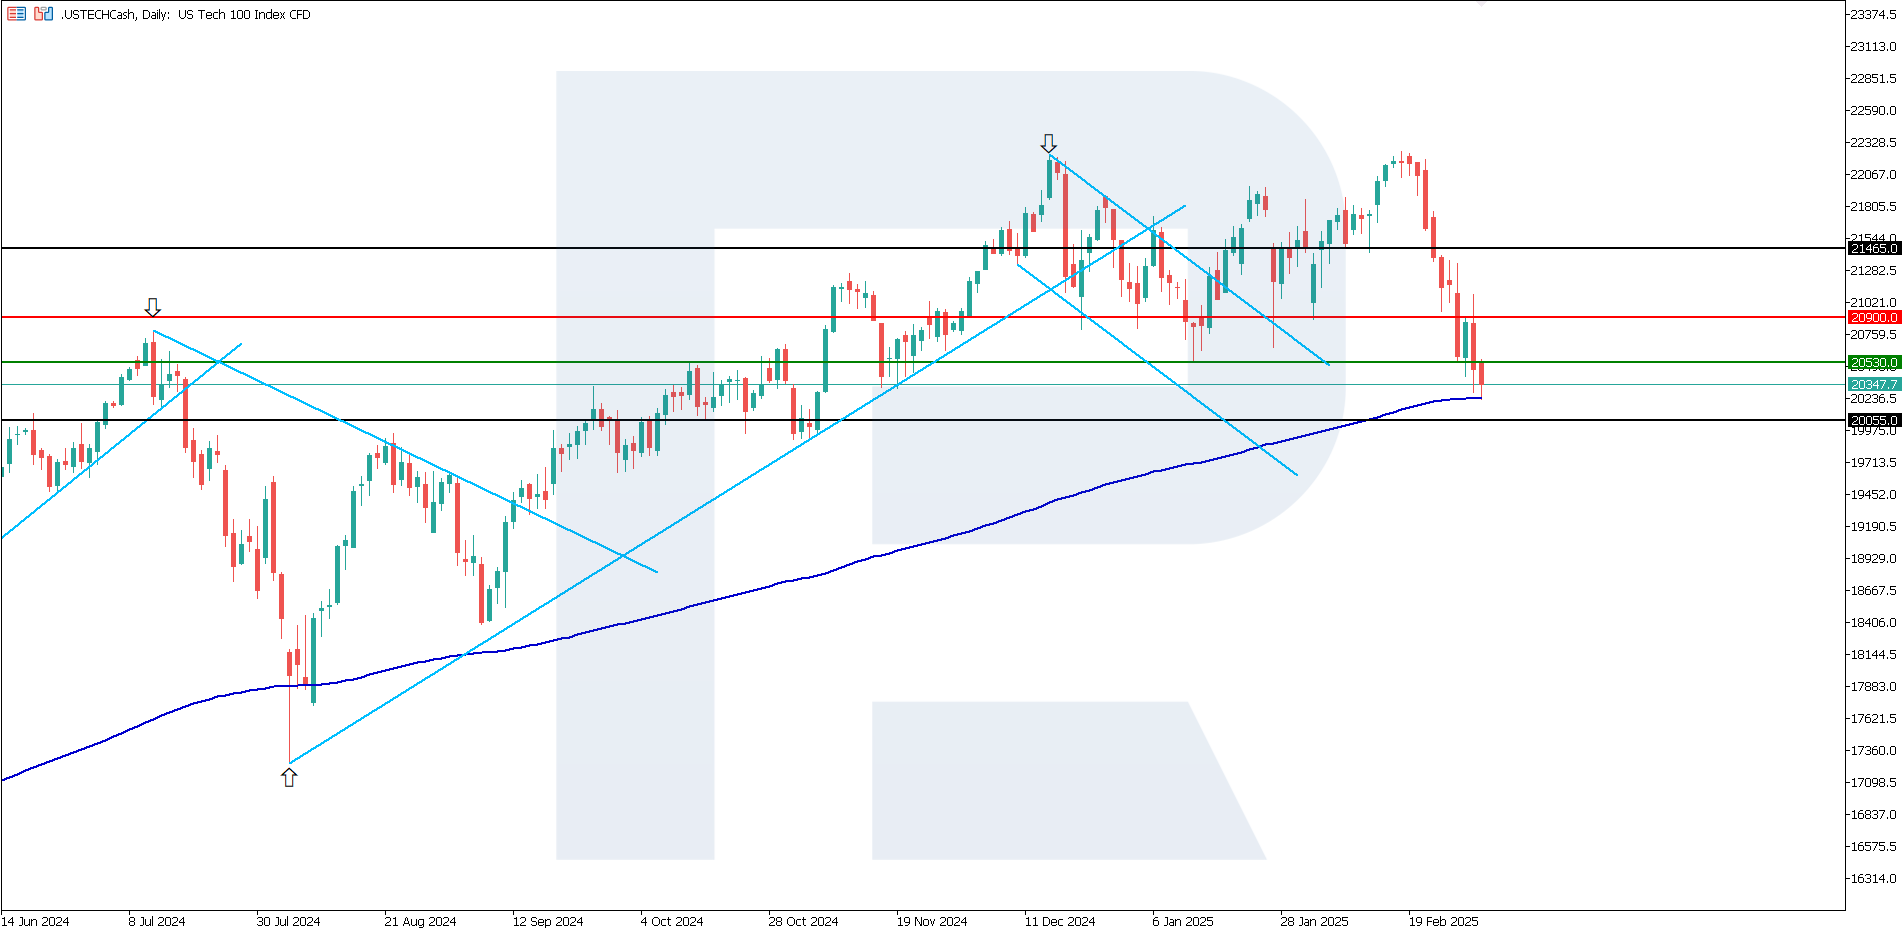
The US Tech stock index touched the 200-day Moving Average for the first time since early August 2024. If the index surpasses it, a protracted downtrend will be highly likely. Otherwise (following a short-term sideways trend), growth could resume.
The following scenarios are considered for the US Tech price forecast:
- Pessimistic US Tech forecast: if the price consolidates below the previously breached support level at 20,530.0, the index could fall to 20,055.0
- Optimistic US Tech forecast: a breakout above the 20,900.0 resistance level could boost the index to 21,465.0
Asian index forecast: JP 225
- Recent data: Japan’s capital expenditures in Q4 2024 decreased by 0.2% year-on-year
- Market impact: the financial sector may also face moderately negative sentiment if lower investment indicates a slowdown in business activity
Fundamental analysis
The decrease in capital expenditures signals that large companies have cut or postponed investment projects, fearing a slowdown in demand and being less optimistic about the economic outlook. For the Japanese stock market, in the short term, this news may negatively impact the stocks of companies dependent on fixed capital investment.
However, much still depends on the Bank of Japan’s stance and further US decisions on tariffs. For this reason, negative sentiment will highly likely prevail among investors in the medium term.
JP 225 technical analysis
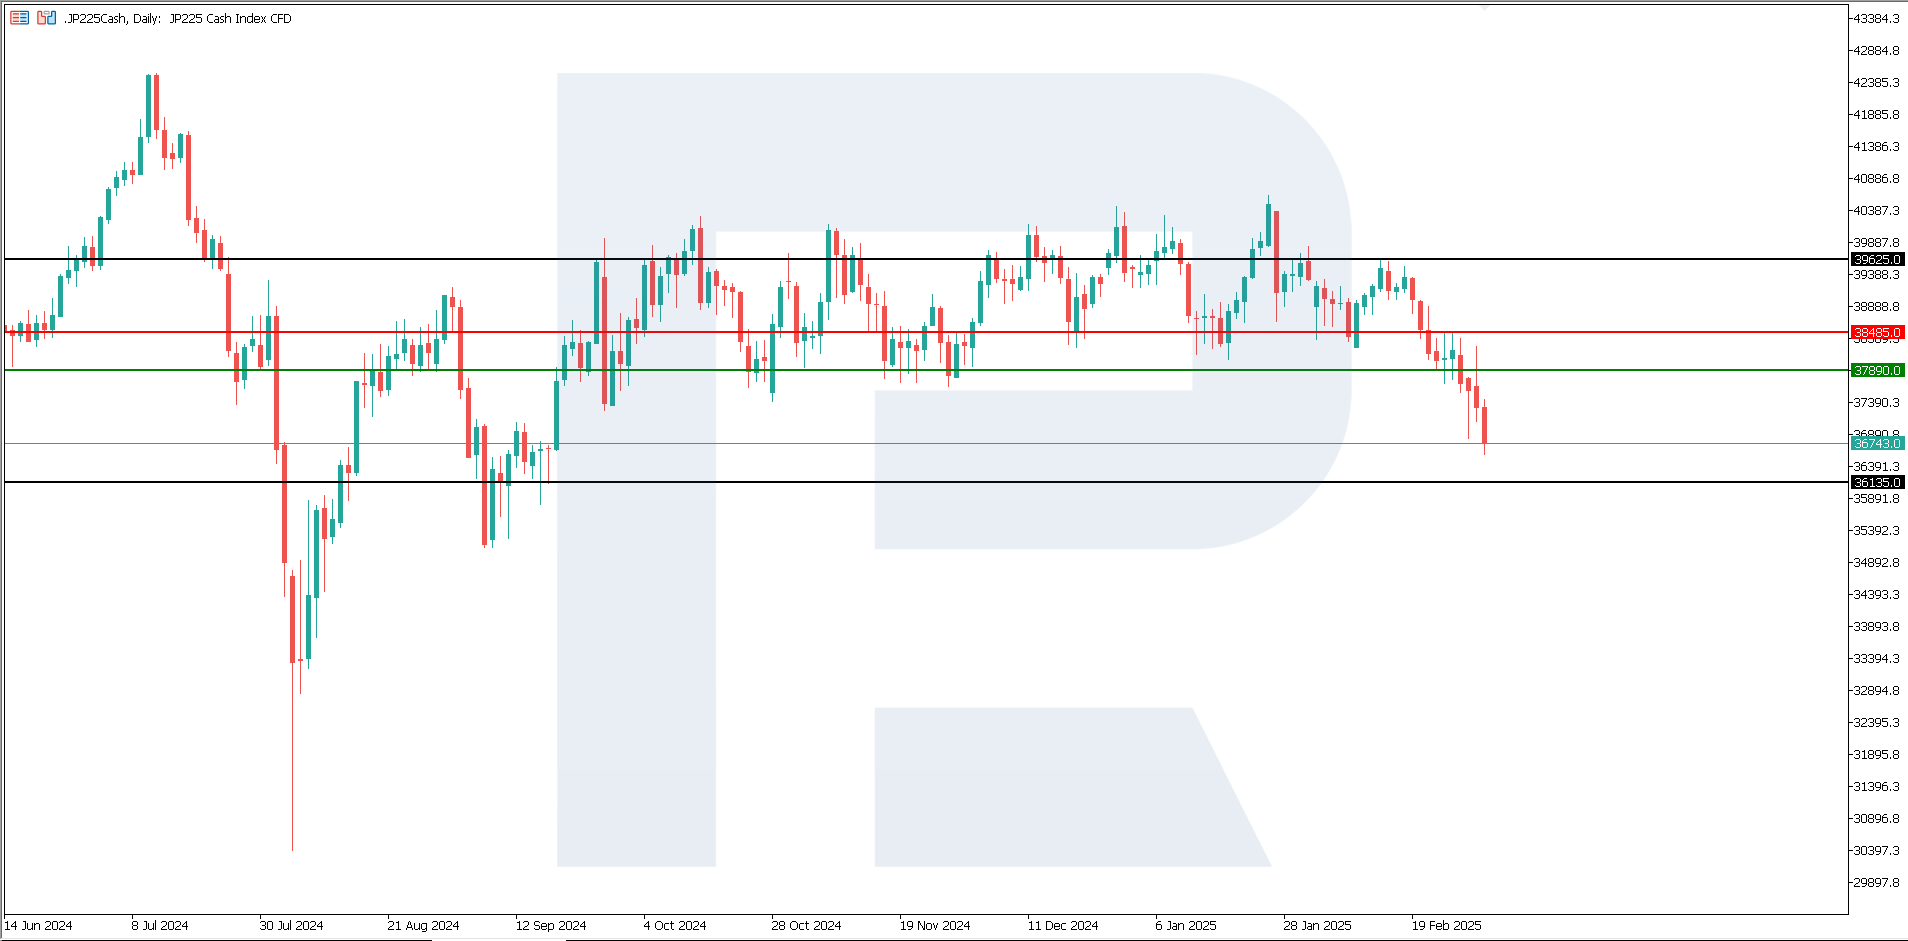
The JP 225 stock index appears to have exited its months-long sideways trend. As part of the downtrend, it broke below the 37,890 support level, with a new one yet to form. The resistance level has shifted to 38,485.0.
The following scenarios are considered for the JP 225 price forecast:
- Pessimistic JP 225 forecast: if the price consolidates below the previously breached support level at 37,890.0, the index could plunge to 36,135.0
- Optimistic JP 225 forecast: a breakout above the 38,485.0 resistance level could propel the index to 39,625.0
European index forecast: DE 40
- Recent data: Deutsche Bundesbank posted the largest loss in its history – 19.2 billion EUR
- Market impact: this could cause short-term market wariness and increase volatility
Fundamental analysis
The German central bank posted an accumulated loss of 19.2 billion EUR for the reporting year 2024. Net interest income, the largest report component, improved slightly by 0.8 billion EUR year-on-year and still remains in negative territory at 13.1 billion EUR. Additional losses are expected to be lower in the future (but still there). The peak of the annual burden is most likely over. At the same time, total assets in 2024 decreased by approximately 149 billion EUR (by 5.9% to 2,373 billion EUR).
For the German stock market, the short-term effect may be moderately negative as this event focuses investor attention on the risks and vulnerabilities of the financial system. However, monetary policy decisions are made by the ECB, and the central bank has no real crisis risk due to losses.
DE 40 technical analysis
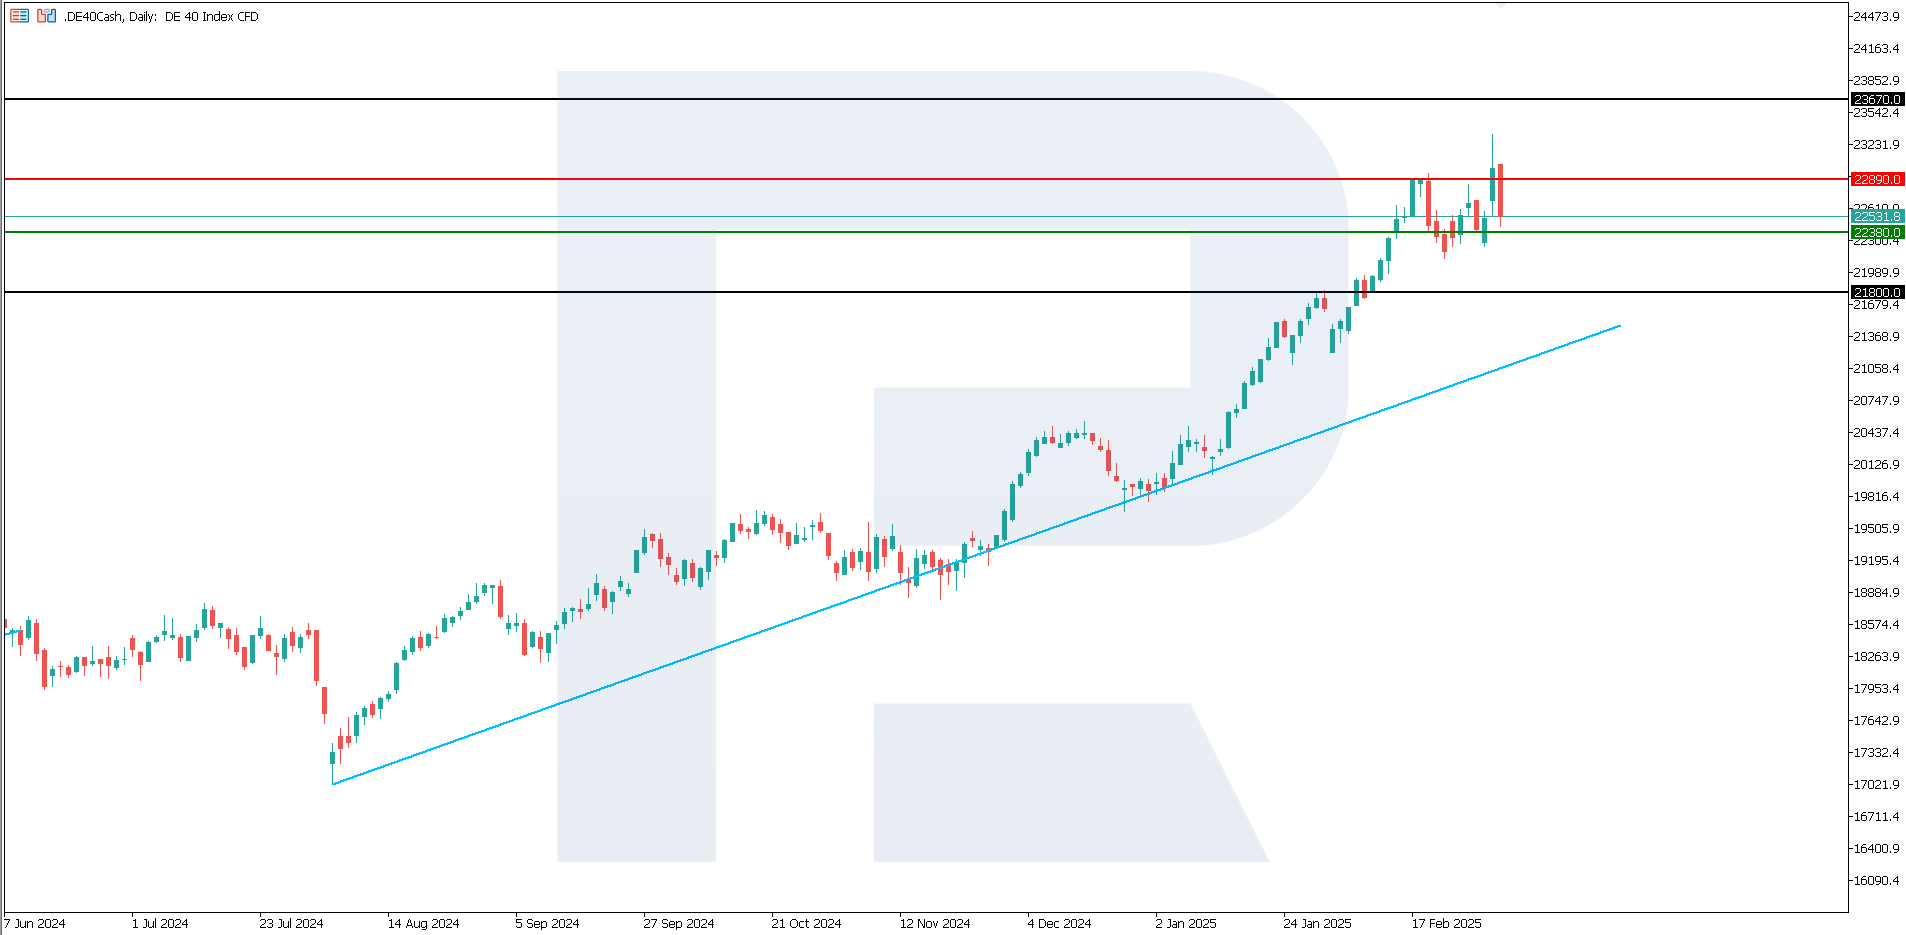
The DE 40 stock index hit a new all-time high, surpassing the 23,320.0 level. At this moment, the index is correcting. According to the DE 40 technical analysis, a breakout above the 22,890.0 resistance level may be false. In this case, the price will break below the 22,380.0 support level, forming a downtrend.
The following scenarios are considered for the DE 40 price forecast:
- Pessimistic DE 40 forecast: a breakout below the 22,380.0 support level could send the index down to 21,800.0
- Optimistic DE 40 forecast: if the price consolidates above the previously breached resistance level at 22,890.0, the index could rise to 23,670.0
Summary
After the White House decided to impose new tariffs on Mexico, Canada, and China, all global stock indices entered a downtrend, except for the German DE 40. However, it will highly likely begin to correct soon due to the introduction of US tariffs for the EU.
Forecasts presented in this section only reflect the author’s private opinion and should not be considered as guidance for trading. RoboForex bears no responsibility for trading results based on trading recommendations described in these analytical reviews.

