World indices overview: news from US 30, US 500, US Tech, JP 225, and DE 40 for 6 February 2025
Global indices continue to correct except for Japan’s JP 225. Find out more in our analysis and forecast for global indices for 6 February 2025.
US indices forecast: US 30, US 500, US Tech
- Recent data: the US S&P composite PMI came in at 52.7 in January
- Market impact: the decrease in the composite PMI indicates a slowdown in economic growth
Fundamental analysis
The PMI is one of the leading indicators, with its weakening (while remaining above 50.0) signalling that business activity is growing but at a slower pace. This may raise concern among investors about the sustainability of corporate earnings, especially in the services sector, which accounts for a large share of the US GDP.
The slowdown in the PMI reflects waning optimism or decreased orders, which could affect companies’ earnings in the long run. In addition, a strong factor of uncertainty is the tariff policy of the new White House administration. For this reason, investors and analysts may start to revise their previous forecasts for quarterly reports downwards.
US 30 technical analysis
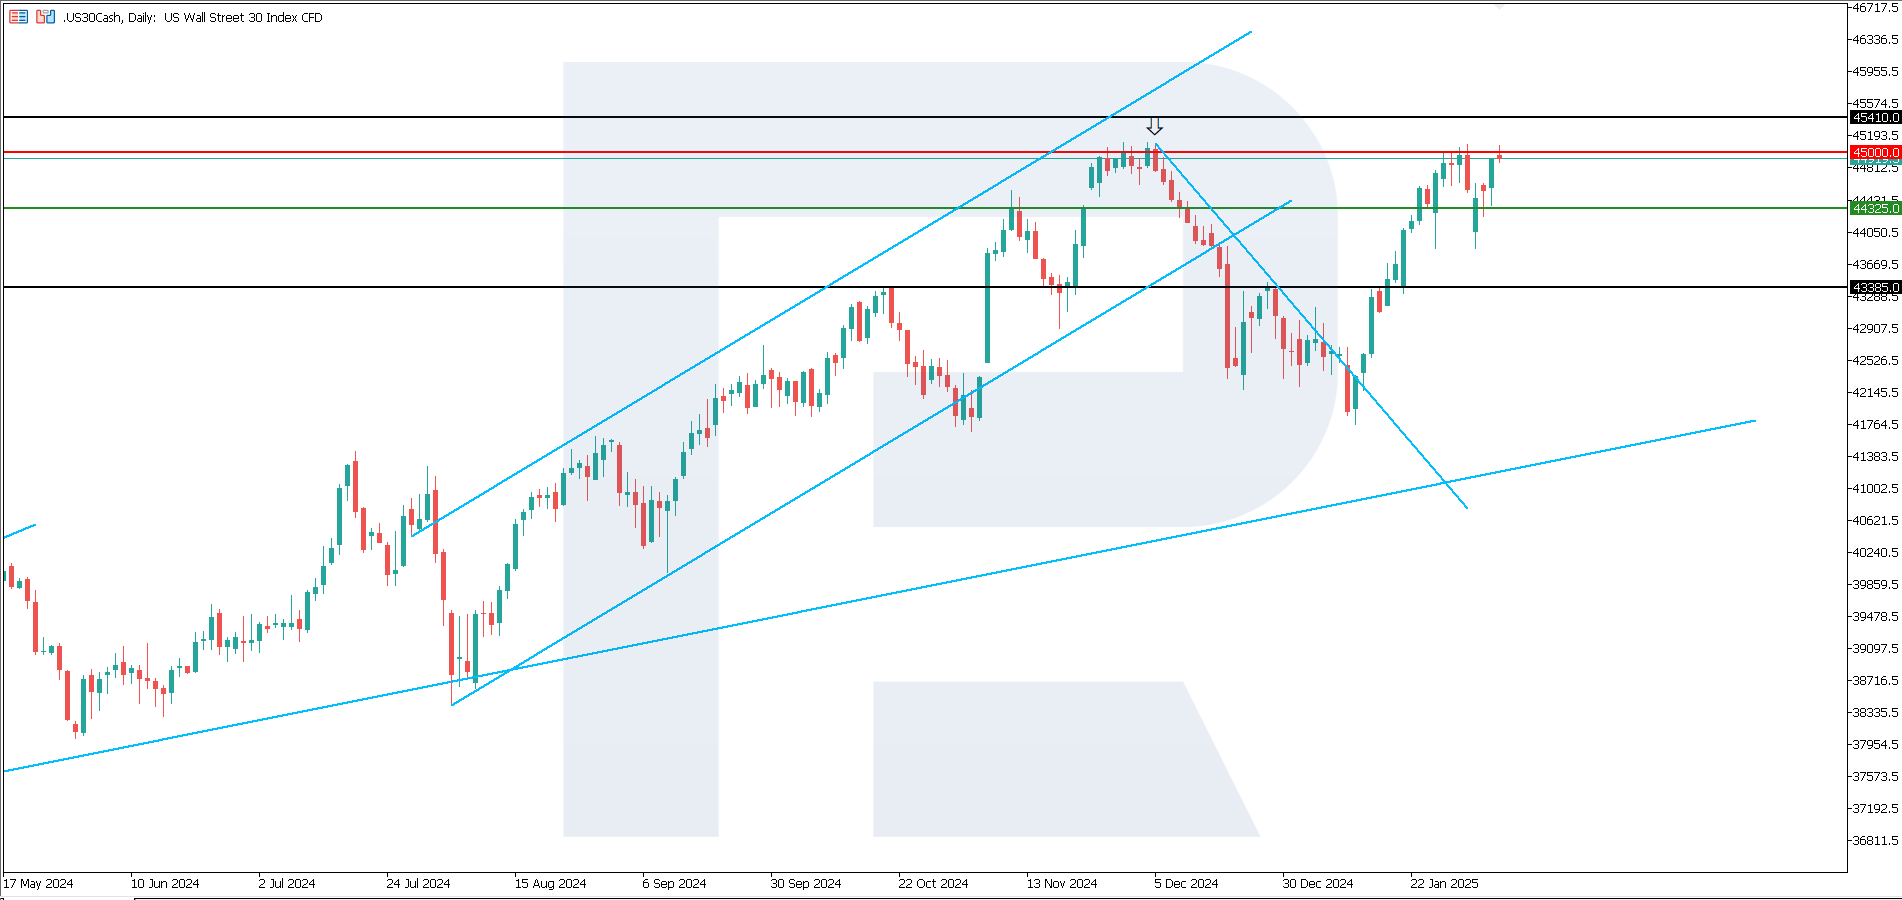
The US 30 stock index continues to recover after the recent fall. The quotes have approached the 45,000.0 resistance level. According to the US 30 technical analysis, a breakout above this level will be a strong driver of further growth.
The following scenarios are considered for the US 30 price forecast:
- Pessimistic US 30 forecast: a breakout below the 44,325.0 support level could send the index down to 43,385.0
- Optimistic US 30 forecast: a breakout above the 45,000.0 resistance level could drive the index to 45,410.0
US 500 technical analysis
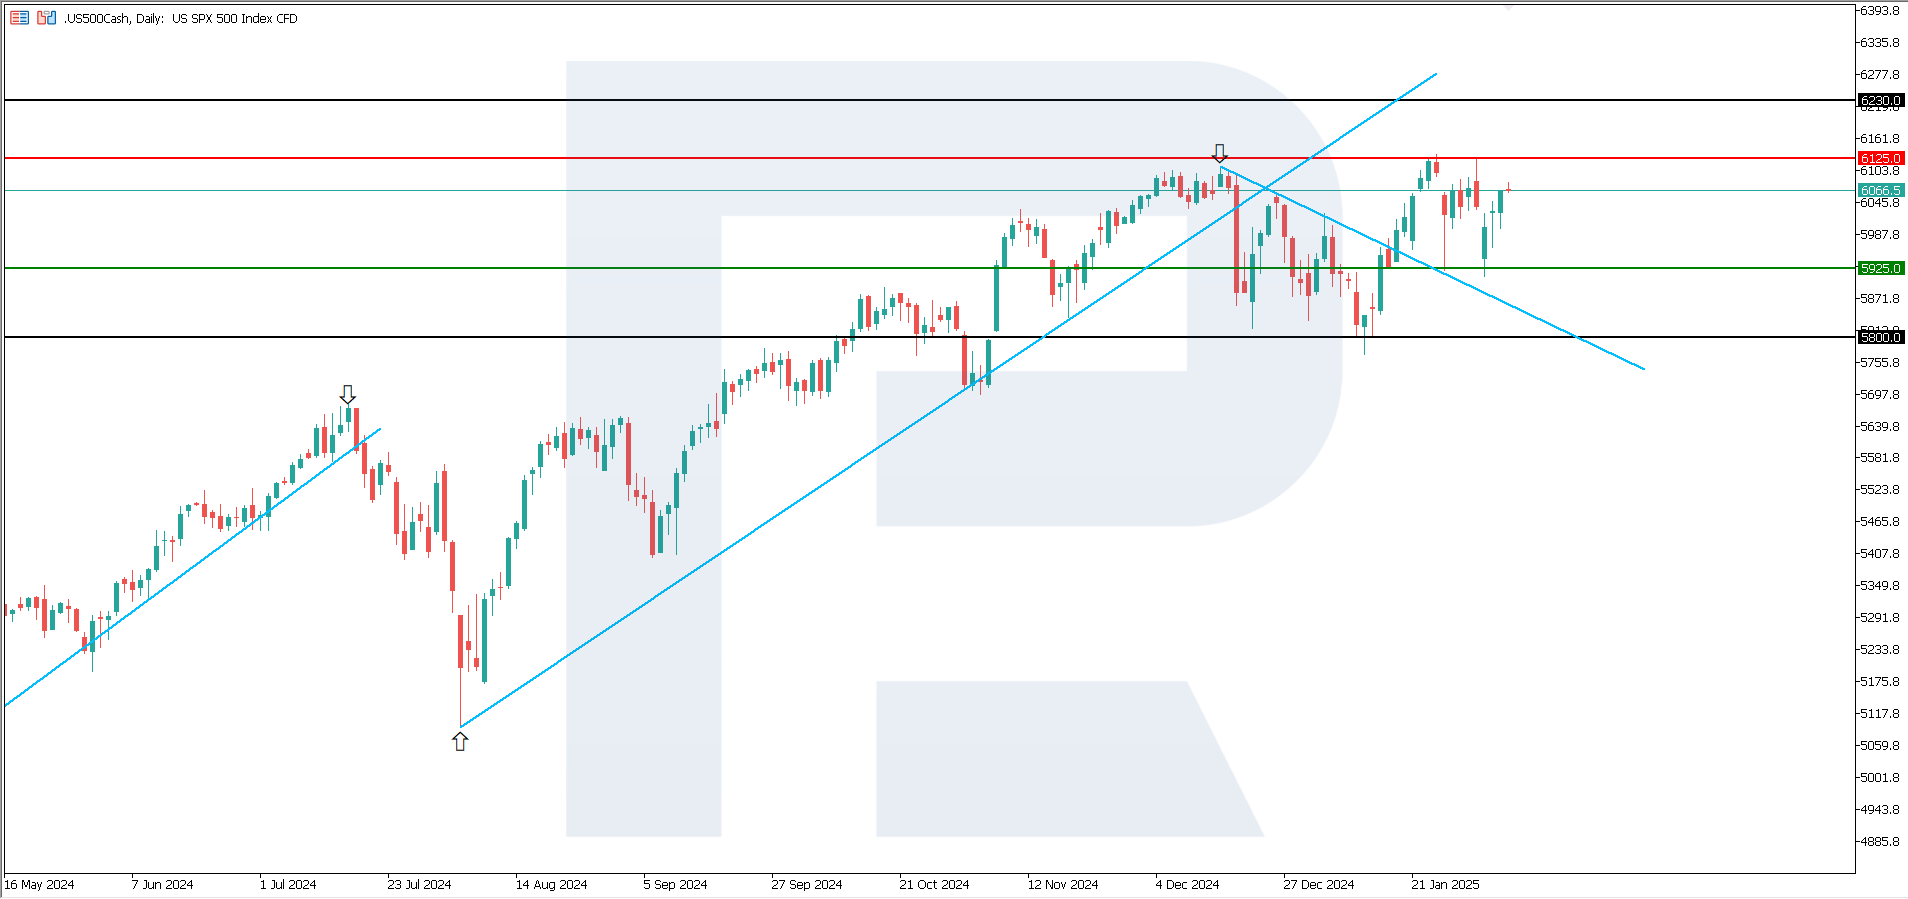
The US 500 stock index is trading within a sideways channel with no signs of a directional trend. Obviously, buyers and sellers achieved a balance of interests. According to the US 500 technical analysis, a breakout of one of the sideways range boundaries will signal the beginning of a trend.
The following scenarios are considered for the US 500 price forecast:
- Pessimistic US 500 forecast: a breakout below the 5,925.0 support level could push the index down to 5,800.0
- Optimistic US 500 forecast: a breakout above the 6,125.0 resistance level could propel the index to 6,230.0
US Tech technical analysis
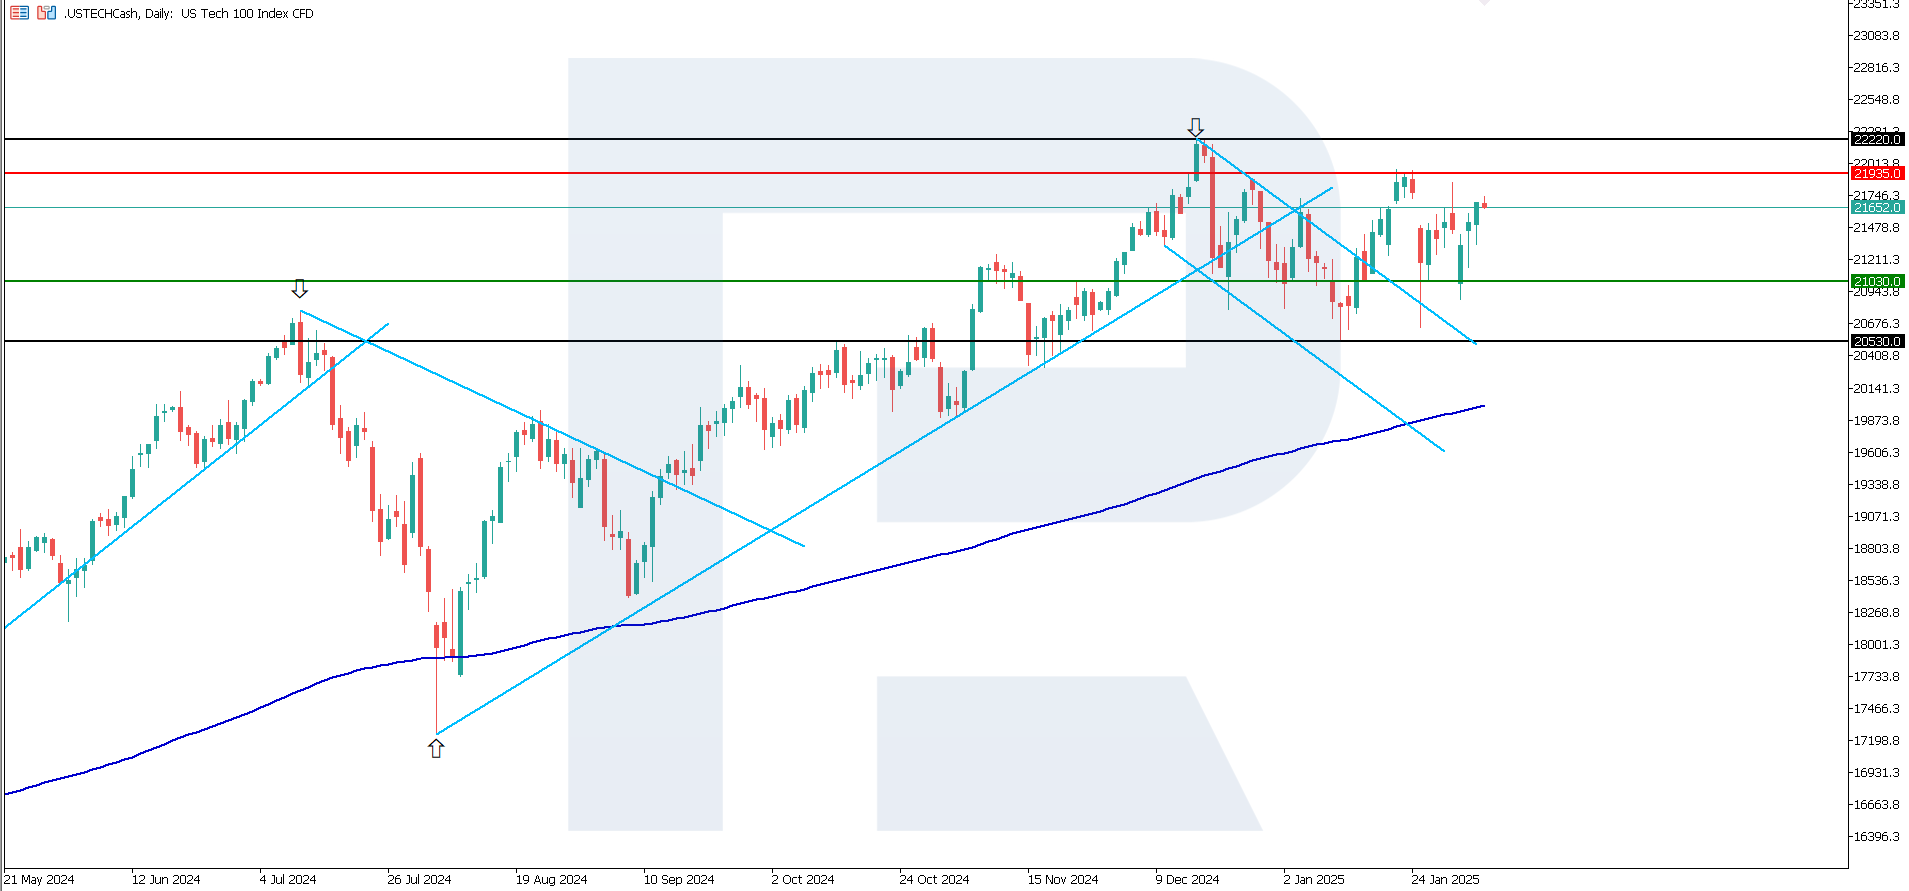
The US Tech stock index continues to correct within a sideways channel. A directional trend is unlikely to form in the short term. According to the US Tech technical analysis, the price will most likely break above the upper boundary of the sideways range at 21,935.0 but only in the medium term.
The following scenarios are considered for the US Tech price forecast:
- Pessimistic US Tech forecast: a breakout below the 21,030.0 support level could send the index down to 20,530.0
- Optimistic US Tech forecast: a breakout above the 21,935.0 resistance level could push the index up to 22,220.0
Asian index forecast: JP 225
- Recent data: Japan’s composite PMI was 51.1 in January
- Market impact: investors are ready to assess the economic outlook more favourably
Fundamental analysis
The rise in the PMI may increase the Bank of Japan’s confidence in further monetary policy tightening. The indicator growth could boost stocks, especially for companies sensitive to domestic demand. Japan’s composite PMI indicates improved economic conditions.
Investors are ready to perceive this data as a signal of positive prospects for companies involved in the services sector and related industries, which will generally positively impact the stock market. However, the regulator may make adjustments.
JP 225 technical analysis
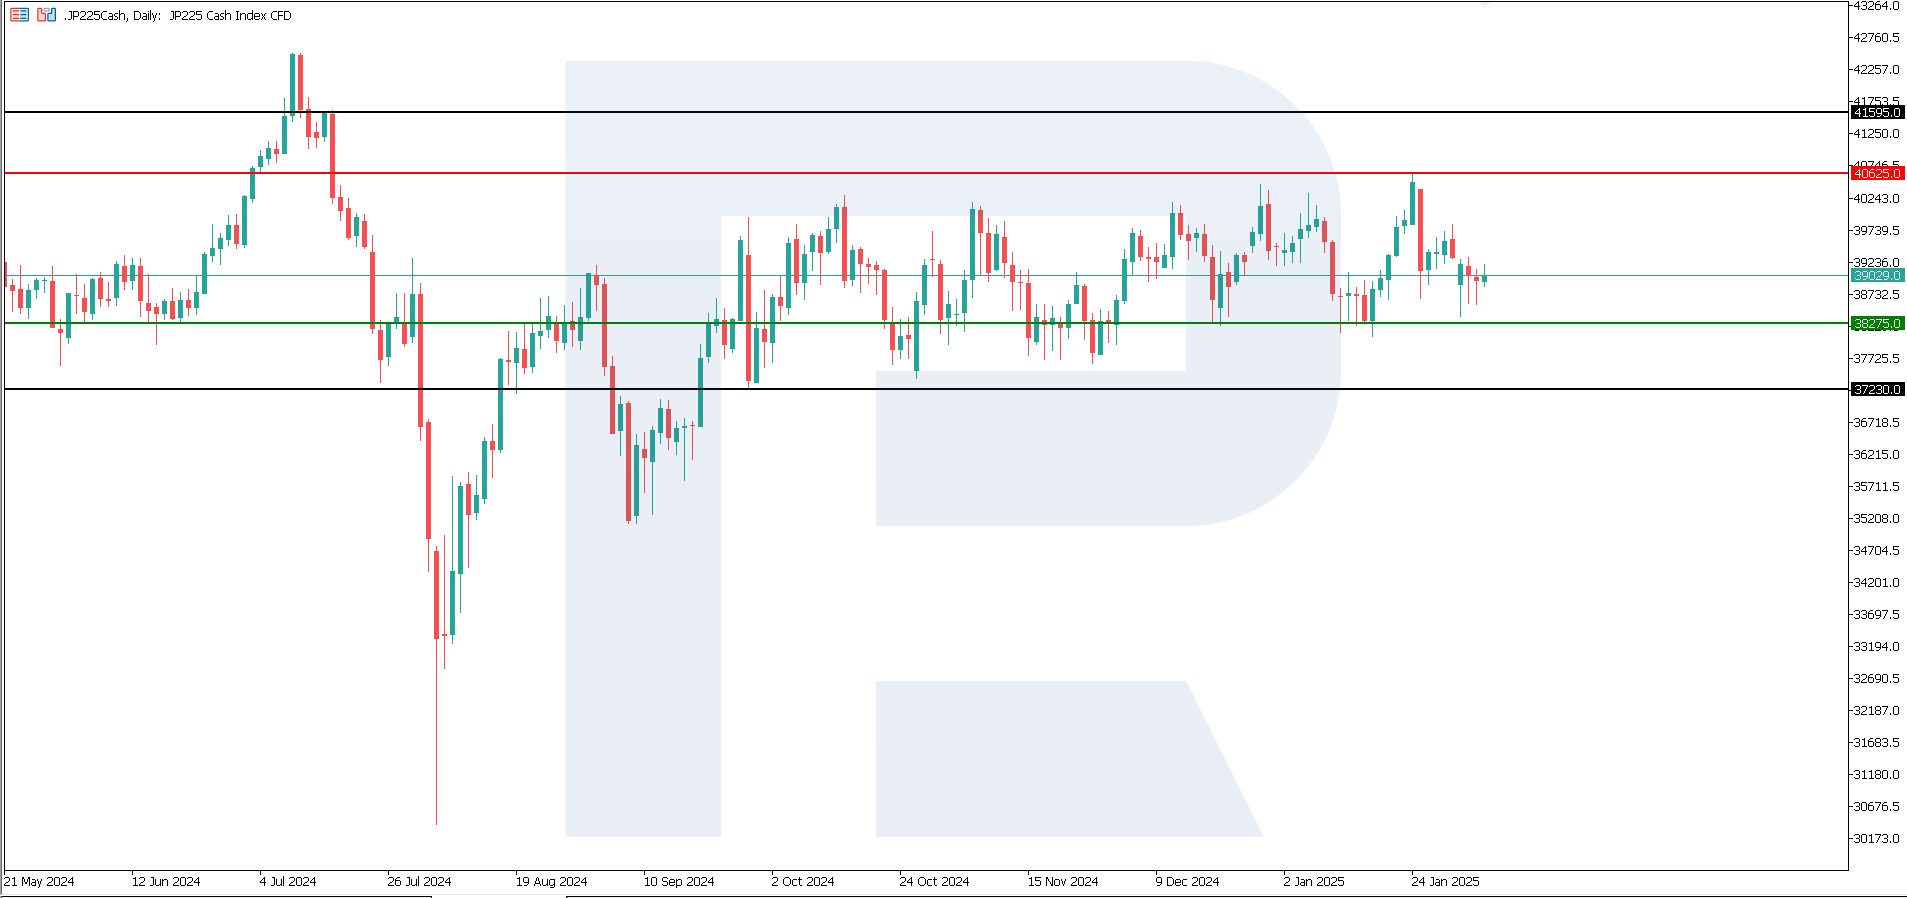
The JP 225 stock index has been hovering in a sideways range since September 2024. There are no factors that could form a trend in the medium term. While the range of fluctuations may vary slightly, most market players seem to be satisfied with the current market sentiment.
The following scenarios are considered for the JP 225 price forecast:
- Pessimistic JP 225 forecast: a breakout below the 38,275.0 support level could push the index down to 37,230.0
- Optimistic JP 225 forecast: a breakout above the 40,625.0 resistance level could propel the index to 41,595.0
European index forecast: DE 40
- Recent data: Germany’s composite PMI increased to 50.5 in January
- Market impact: the composite PMI shifted from an area below 50.0 (contraction) to readings above this level (expansion), which may push stock prices higher
Fundamental analysis
Robust macroeconomic data on the eurozone’s largest economy may impact the ECB tone. If the economy shows signs of recovery, the regulator will continue its monetary easing course. The release of stronger-than-expected PMI readings is typically perceived positively and could increase optimism, driving up stock prices.
The composite PMI reaching the area above 50.0 is a good sign for the German economy, which typically positively affects stock indices and individual companies focused on domestic demand. If the positive trend persists and other macroeconomic indicators (industrial production, employment, and retail sales) continue to strengthen, this will stimulate an upward movement in the stock market.
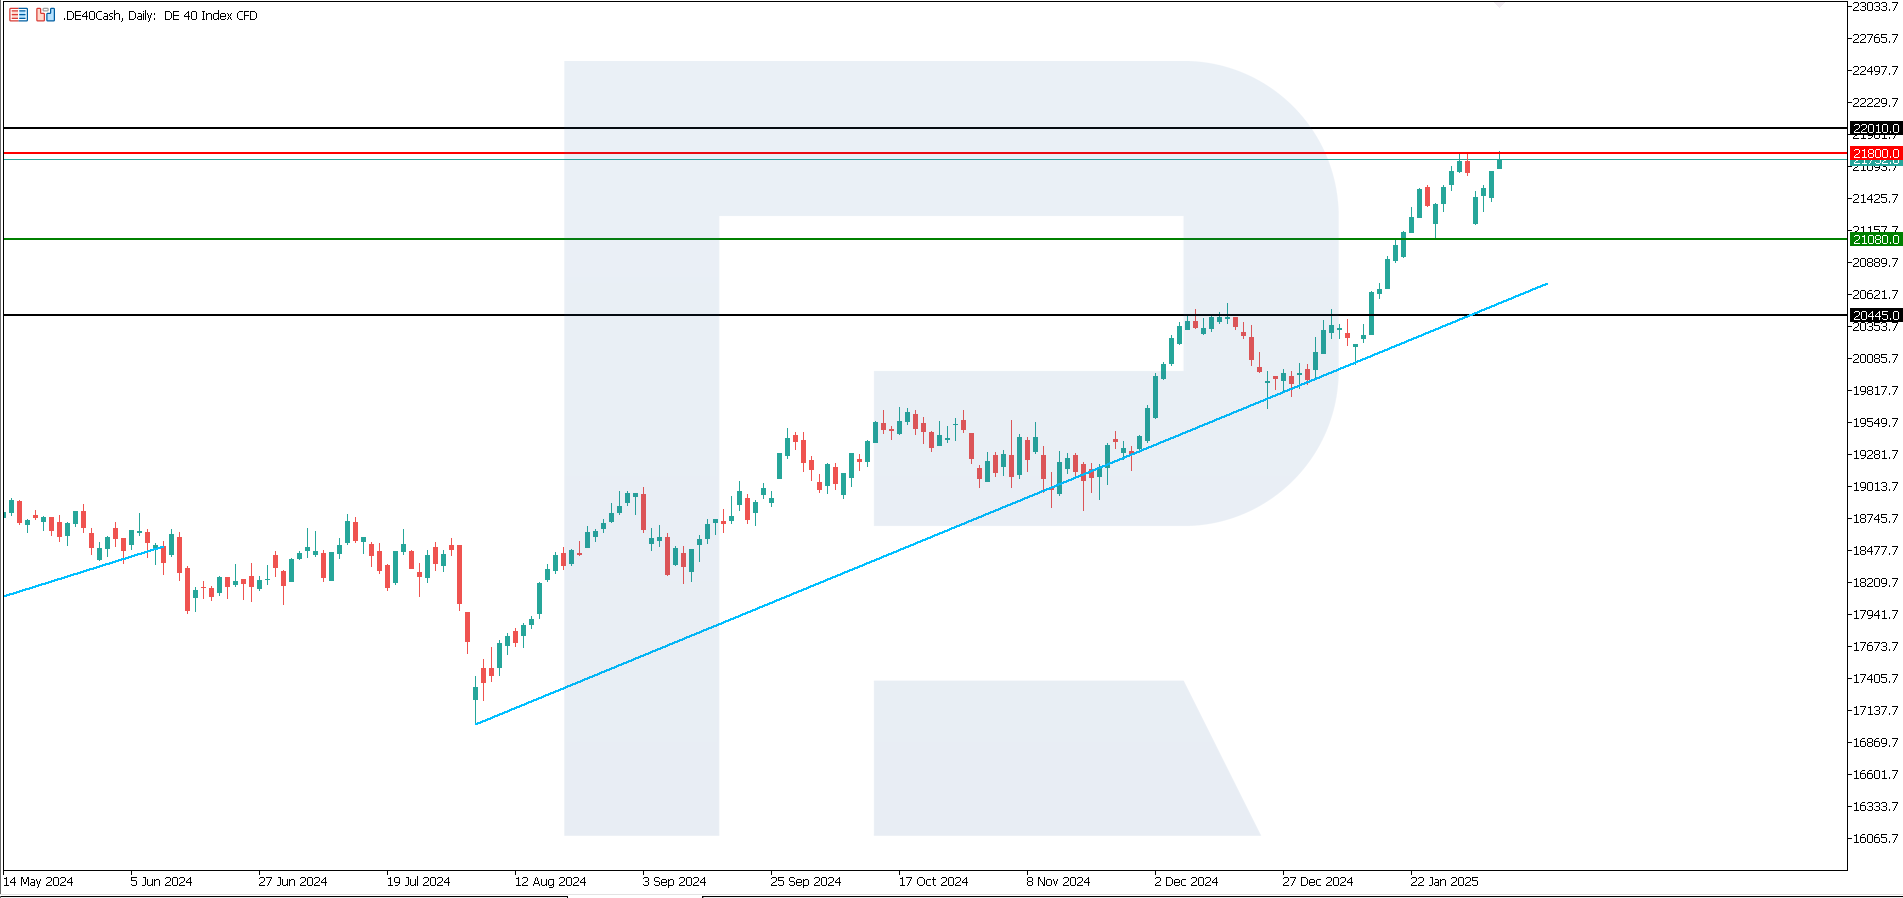
DE 40 technical analysis
The DE 40 stock index maintains its upward momentum. According to the DE 40 technical analysis, growth will likely continue in the short term, with the index reaching a new all-time high. A reversal to the downside will be possible only if the price breaks below the 21,080.0 support level.
The following scenarios are considered for the DE 40 price forecast:
- Pessimistic DE 40 forecast: a breakout below the 21,080.0 support level could send the index down to 20,445.0
- Optimistic DE 40 forecast: a breakout above the 21,800.0 resistance level could drive the index to 22,010.0
Summary
Except for the US 30 index, all US stock indices have consolidated in sideways channels. Investors are now awaiting new tariff decisions from the US administration. The DE 40 index maintained its upward momentum after the correction. Meanwhile, Japan’s JP 225 has remained sideways since September last year. The US employment data will have a strong impact on the markets.
Forecasts presented in this section only reflect the author’s private opinion and should not be considered as guidance for trading. RoboForex bears no responsibility for trading results based on trading recommendations described in these analytical reviews.