US 30 analysis: the index edges down slightly; after the previous rally, this is normal
The US 30 index has experienced local pressure. The market is conserving its strength ahead of Powell’s speech at Jackson Hole. Find out more in our US 30 forecast for next week.
US 30 forecast: key trading points
- US 30 still has growth potential
- Investors are eagerly waiting for the Federal Reserve’s comments at the Jackson Hole Symposium
- Resistance: 41,470.0, Support: 40,100.0
- US 30 price forecast: 41,880.0
Fundamental analysis
US markets are awaiting today’s speech by US Federal Reserve Chair Jerome Powell at the Jackson Hole Symposium, with a keen interest in the future interest rate outlook.
The US 30 fell by 0.43% in regular trading yesterday. Of the eleven broad market sectors, eight declined, led by the technology and communications sectors.
Snowflake’s stock tumbled by 14.7% due to a relatively weak sales outlook. In after-hours trading, shares of Cava Group and Ross Stores rose by 9.0% and 5.6% respectively, supported by optimistic forecasts.
The US 30 index forecast suggests a further rally.
US 30 technical analysis
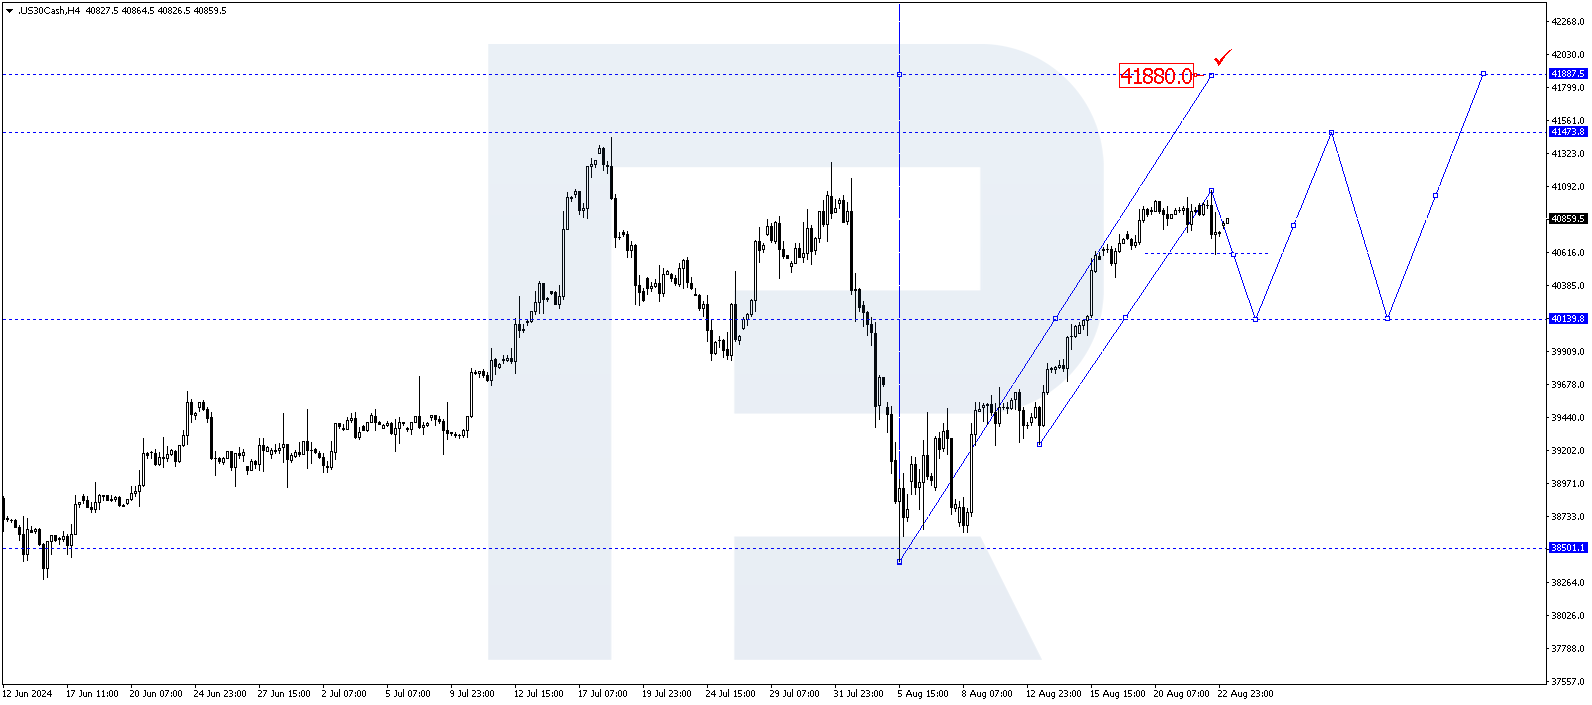
The US 30 H4 chart shows that the market broke above the 40,140.0 level and rose to 41,055.0 before declining to 40,060.0. The market found support at this level, forming a consolidation range above it. Today, 23 August 2024, a breakout above the range could enable the growth wave to continue to 41,474.0. Conversely, a downward breakout could trigger a correction to 40,140.0 (testing from above). Subsequently, the price is expected to increase to 41,470.0, potentially continuing the trend to 41,880.0, the first target.
Key US 30 levels to watch:
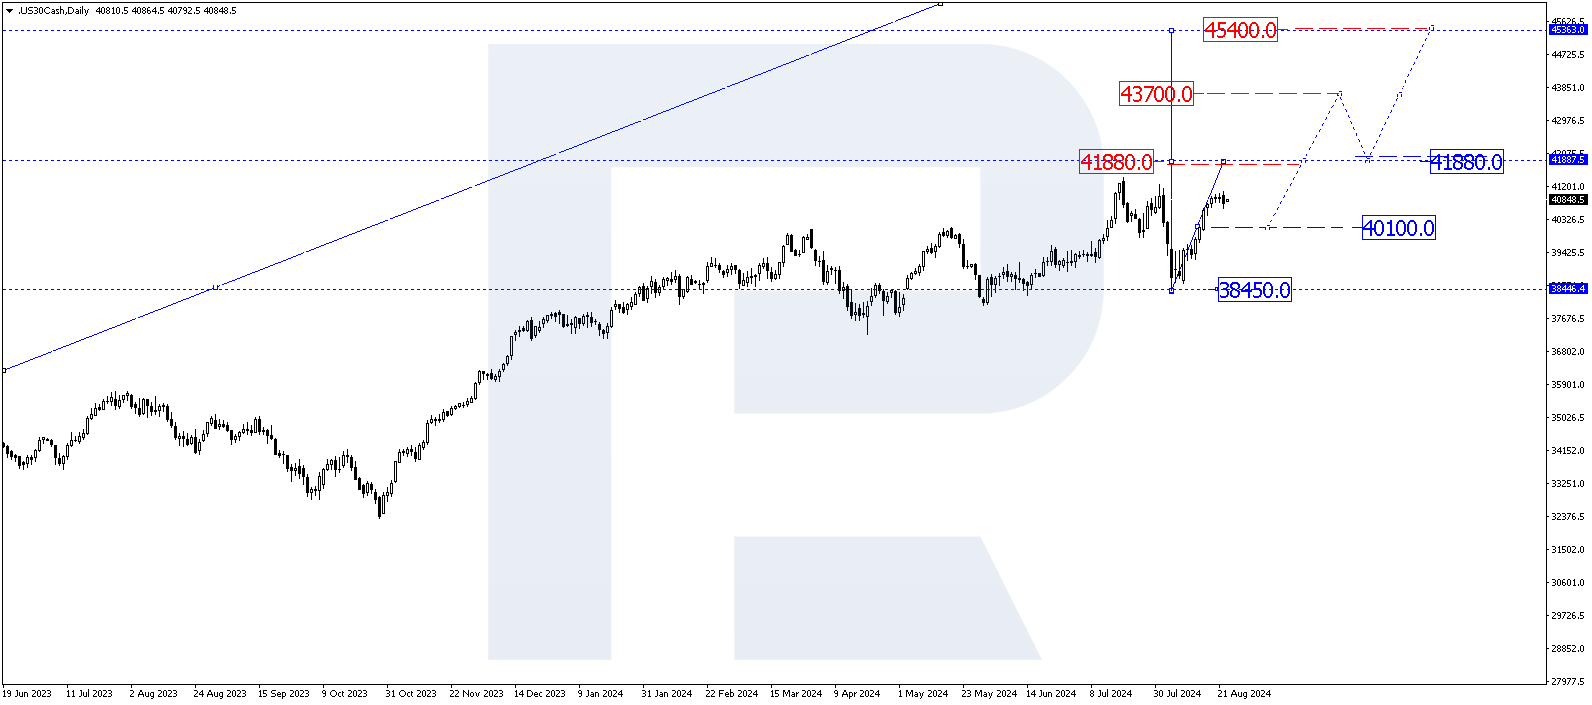
- Resistance level: 41,880.0 – with an upward breakout, the price could reach 43,700.0
- Support level: 40,100.0 – a breakout below this level would signal that the trend continues to 38,450.0
Summary
Despite the local decline, the US 30 index looks positive. Technical indicators suggest that the index could continue to rise to 41,800.0.
Forecasts presented in this section only reflect the author’s private opinion and should not be considered as guidance for trading. RoboForex bears no responsibility for trading results based on trading recommendations described in these analytical reviews.