EURUSD, USDJPY, GBPUSD, AUDUSD, USDCAD, XAUUSD, and Brent technical analysis and forecast for 22 April 2025
Here is a detailed daily technical analysis and forecast for EURUSD, USDJPY, GBPUSD, AUDUSD, USDCAD, XAUUSD, and Brent for 22 April 2025.
EURUSD forecast
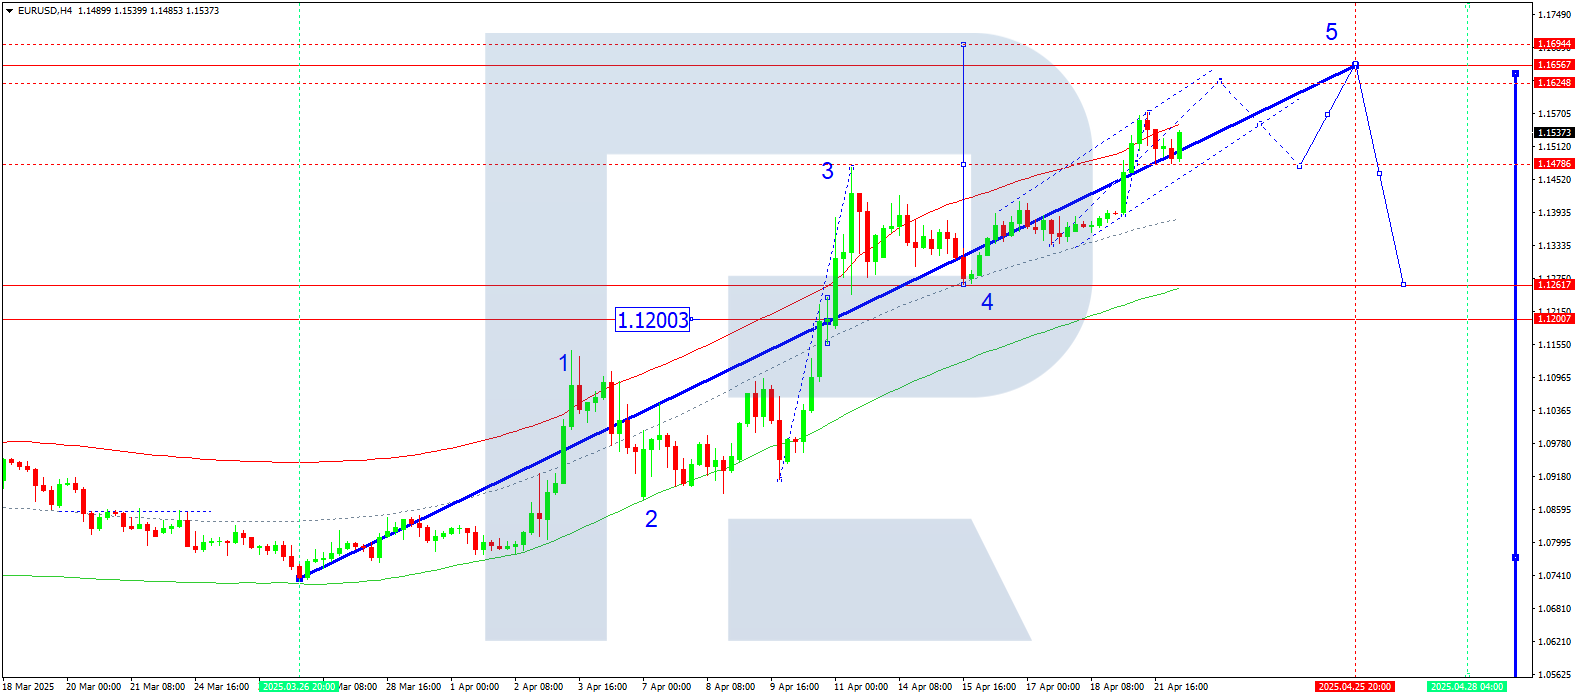
On the H4 chart, EURUSD completed a growth wave to 1.1572 and corrected to 1.1480. Today, 22 April 2025, after receiving support at 1.1480, the market may extend the growth wave to 1.1620 with a potential continuation to 1.1650. Afterwards, a correction towards 1.1477 is possible.
Technically, this scenario is supported by the Elliott wave structure and the growth wave matrix with a pivot at 1.1200, which is crucial in the current wave structure. The market is developing a growth wave towards the upper boundary of the price Envelope at 1.1620. A possible reversal towards the central line at 1.1477 may follow.
Technical indicators for today’s EURUSD forecast suggest a growth wave to 1.1620.
USDJPY forecast
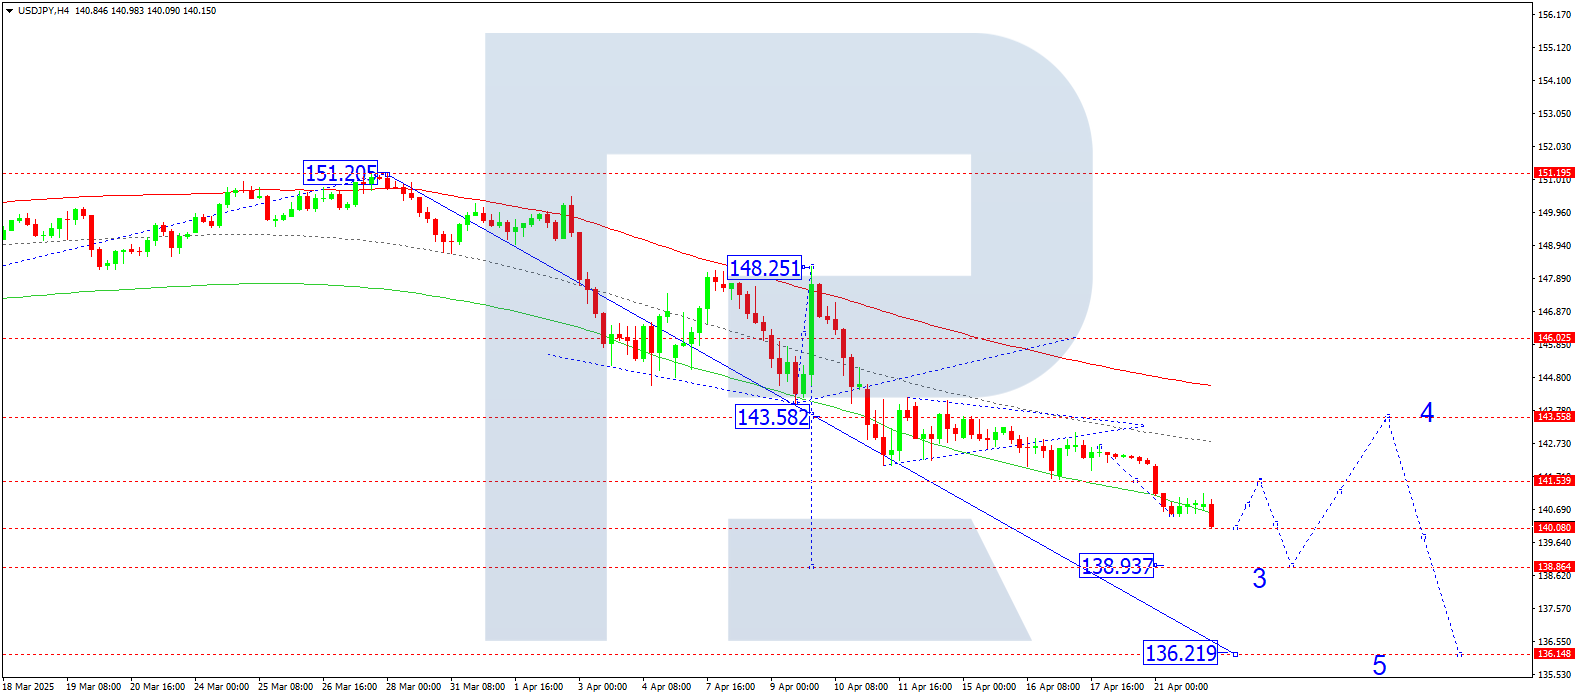
On the H4 chart, USDJPY continues its downward movement towards 140.00. Today, 22 April 2025, a short-term correction to 141.50 is possible, followed by a further decline to 138.94. A subsequent correction to 143.55 may then develop.
Technically, the scenario is confirmed by the Elliott wave structure and the downward wave matrix with a pivot at 143.55, seen as the key level. The market continues a decline towards the lower boundary of the price Envelope at 138.94. A possible rebound to the central line at 141.50 may occur before the price resumes its movement towards the lower boundary at 136.20.
Technical indicators for today’s USDJPY forecast suggest a downward wave to 138.94.
GBPUSD forecast
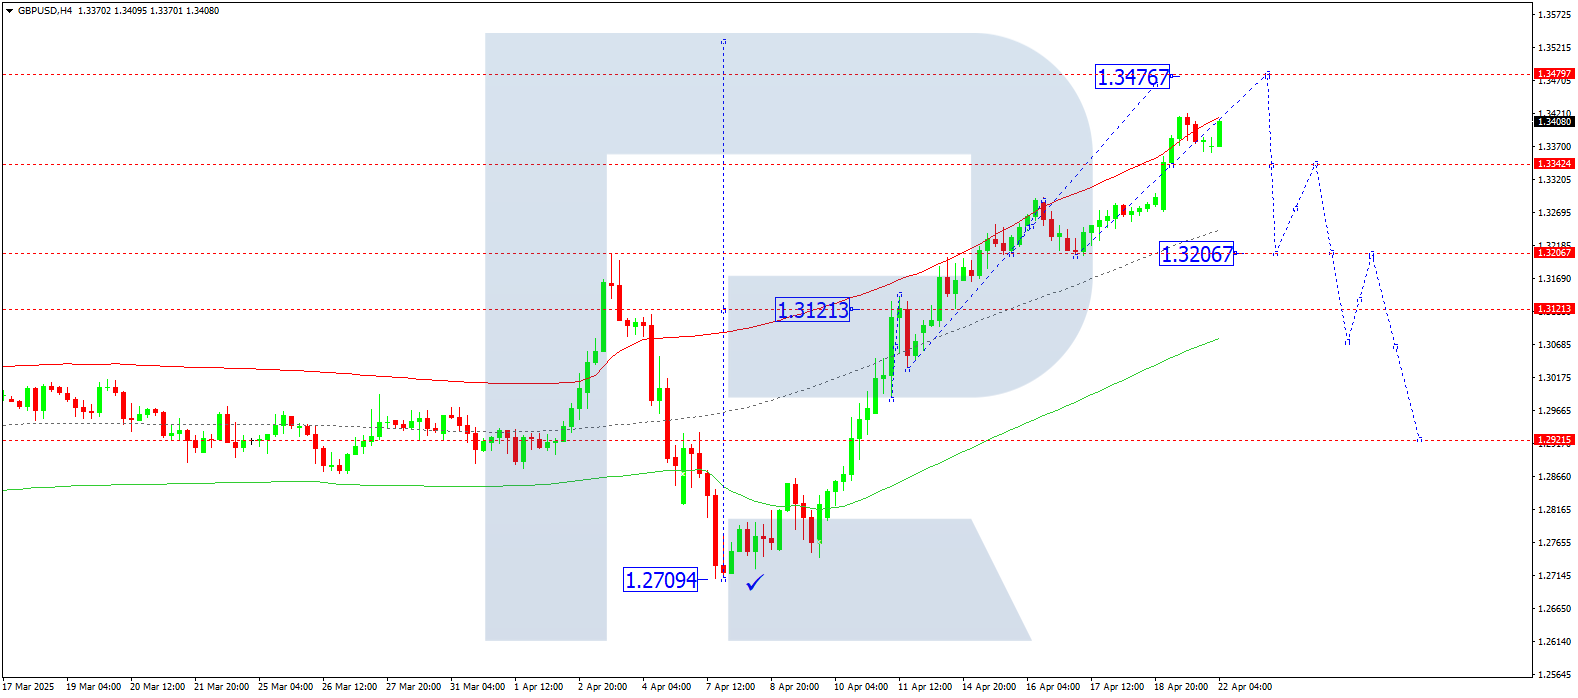
On the H4 chart, GBPUSD is continuing its upward movement towards 1.3477. Today, 22 April 2025, the price may reach this target before starting a decline to 1.3300. If the price breaks below this level, the wave may extend to 1.3200.
Technically, the Elliott wave structure and the growth wave matrix with a pivot at 1.3131 confirm this scenario. This level is key in the current wave. The market is forming a wave towards the upper boundary of the price Envelope at 1.3477. A reversal to the central line at 1.3300 may follow.
Technical indicators for today’s GBPUSD forecast suggest a growth wave to 1.3477.
AUDUSD forecast
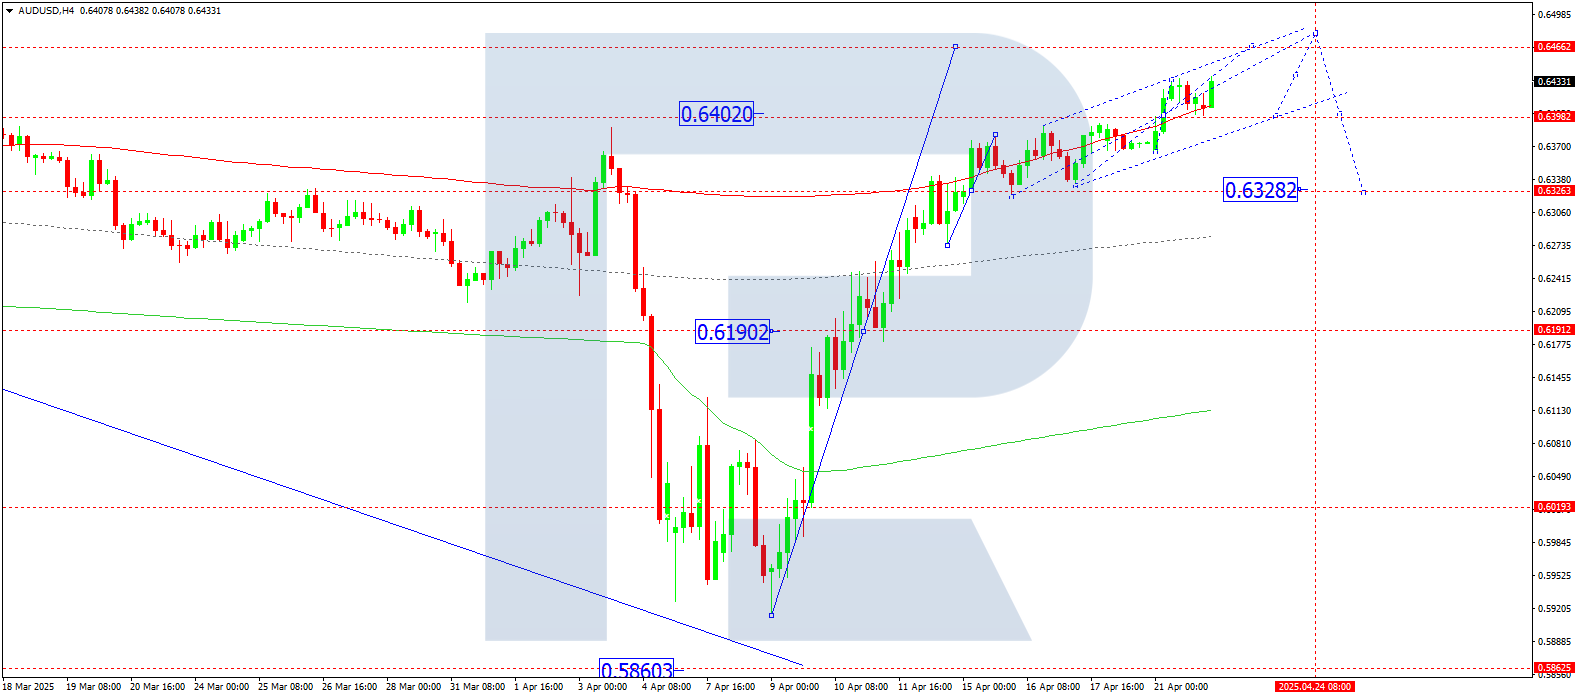
On the H4 chart, AUDUSD received support at 0.6400 and may now rise to 0.6466. Today, 22 April 2025, this target could be reached, followed by a decline to 0.6400. If this level breaks, the price may continue falling to 0.6330, the first target.
Technically, this scenario is supported by the Elliott wave structure and the growth wave matrix with a pivot at 0.6190, which is key in the current wave. The market is forming a wave to the upper boundary of the price Envelope at 0.6466. A reversal to the central line at 0.6330 is possible.
Technical indicators for today’s AUDUSD forecast suggest a continued rise to 0.6466.
USDCAD forecast
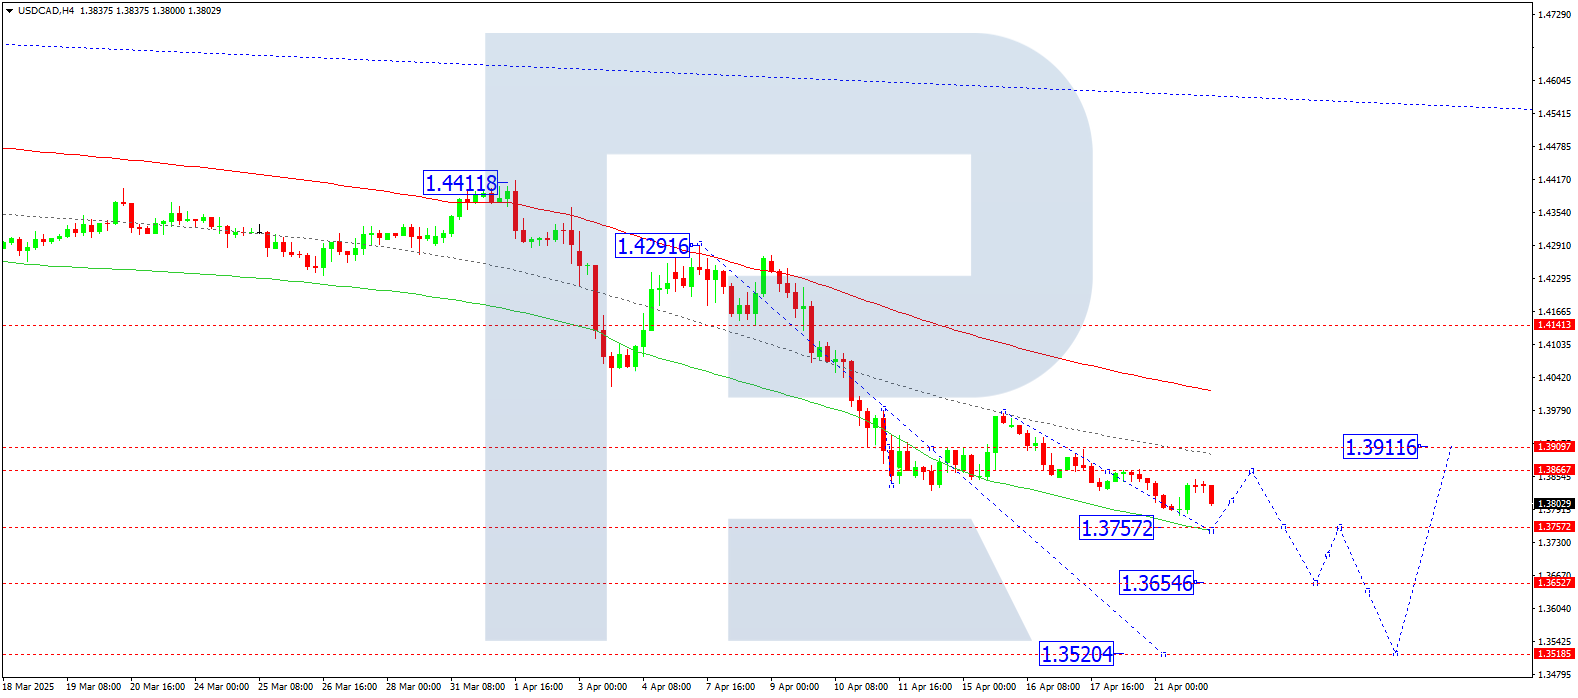
On the H4 chart, USDCAD continues to decline towards 1.3757. Today, 22 April 2025, the wave may stretch to 1.3750. A subsequent rise to 1.3866 is possible, followed by a decline to 1.3655.
Technically, the Elliott wave structure and the downward wave matrix with a pivot at 1.4055 confirm this scenario. This level is crucial for the current wave. The market is developing a decline to the lower boundary of the price Envelope at 1.3757. A rebound to the central line at 1.3866 may follow.
Technical indicators for today’s USDCAD forecast suggest a decline to 1.3757.
XAUUSD forecast
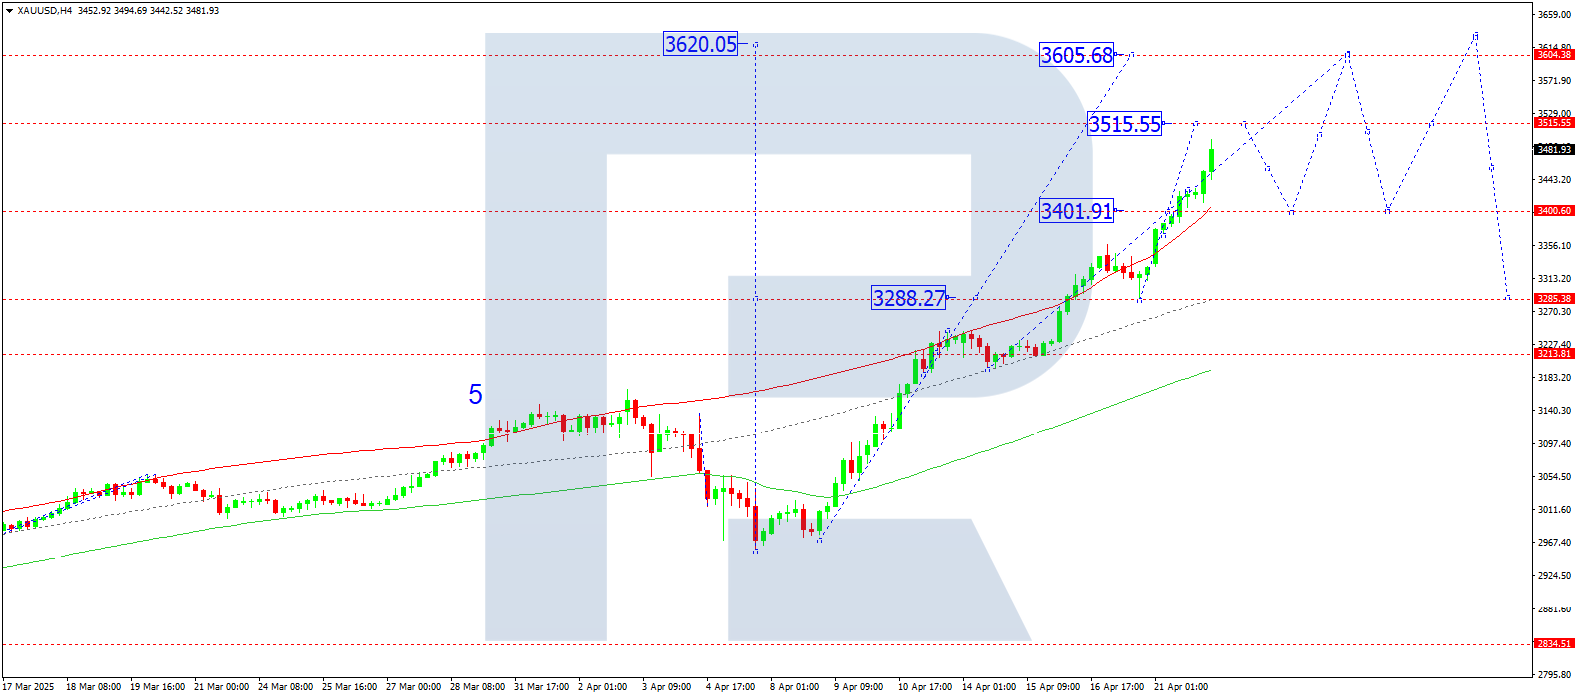
On the H4 chart, XAUUSD broke through 3,400 and continues to grow towards 3,515. Today, 22 April 2025, this level may be reached. A correction to 3,400 (testing from above) may follow. Afterwards, the wave may extend to 3,600.
Technically, the scenario is supported by the Elliott wave structure and the growth wave matrix with a pivot at 3,288, considered key in this wave. The market is forming a wave towards the upper boundary of the price Envelope at 3,515. A possible reversal to the central line at 3,288 may develop later.
Technical indicators for today’s XAUUSD forecast suggest a growth wave to 3,515.
Brent forecast
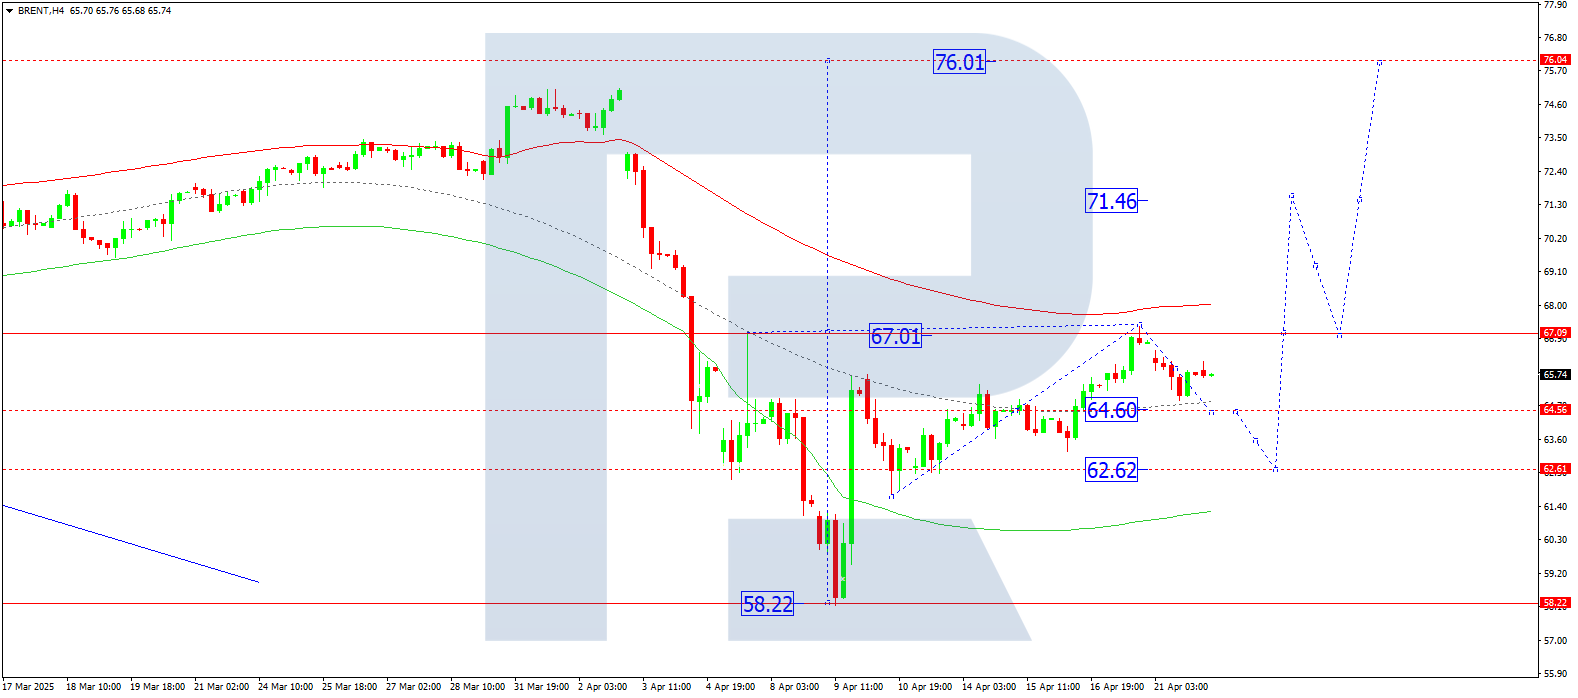
On the H4 chart, Brent is forming a consolidation range around 65.95. Today, 22 April 2025, a correction to 64.60 is possible. If the price breaks this level, the correction may extend to 62.62. Afterwards, a rise to 71.50 may follow — a local projected target.
Technically, the scenario is confirmed by the Elliott wave structure and the downward wave matrix with a pivot at 67.00, key to the current wave. The market has completed a wave to the upper boundary of the price Envelope at 67.38. A correction to the central line at 64.60 is relevant.
Technical indicators in today’s Brent forecast suggest a downward correction towards 64.60.
Forecasts presented in this section only reflect the author’s private opinion and should not be considered as guidance for trading. RoboForex bears no responsibility for trading results based on trading recommendations described in these analytical reviews.