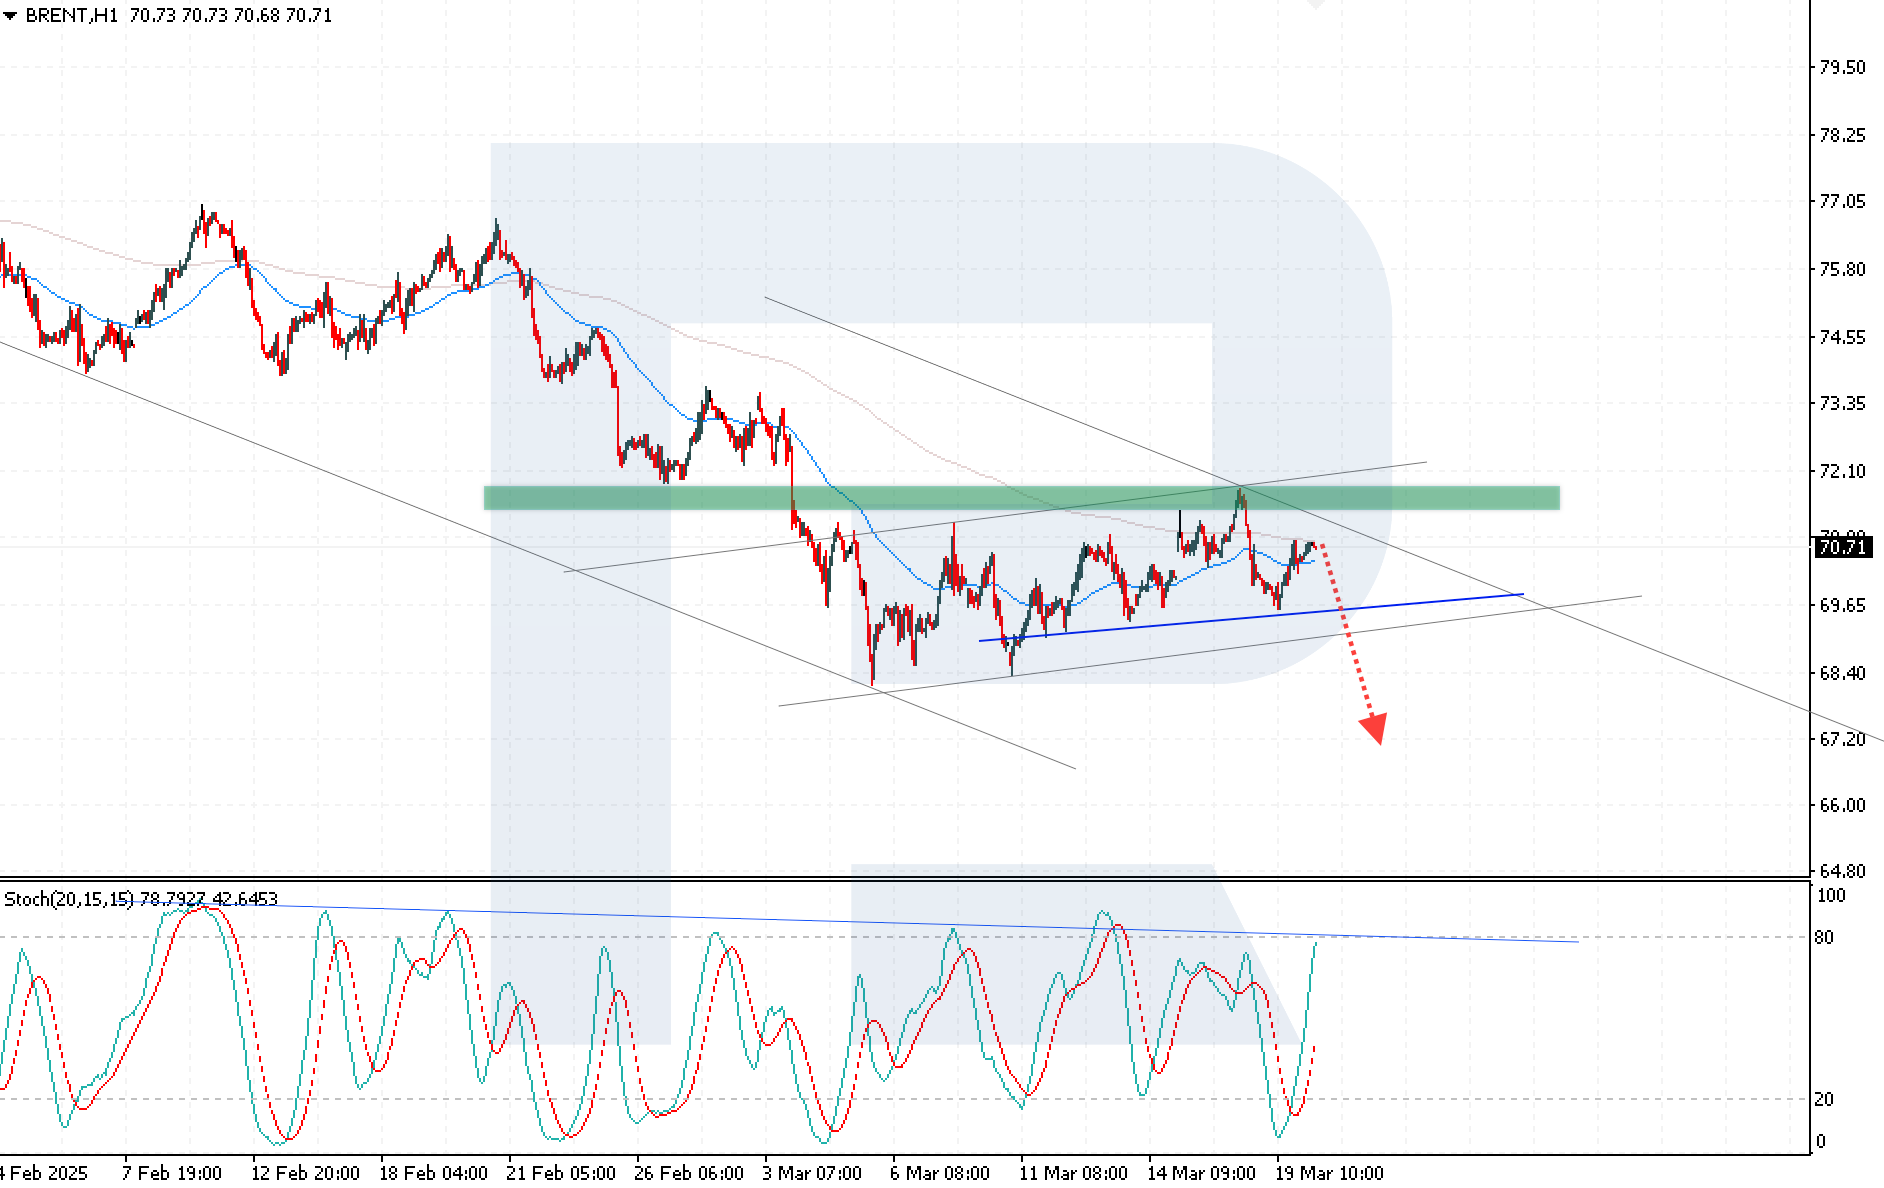
Can a reversal pattern send down Brent prices?
Brent prices are strengthening, currently standing at 70.99 USD. Discover more in our analysis for 20 March 2025.
Brent forecast: key trading points
- US gasoline and distillate inventories fell to their lowest levels since early 2025
- The Head and Shoulders pattern on the Brent chart indicates a potential price decline
- Brent forecast for 20 March 2025: 66.65
Fundamental analysis
Brent prices continue to rise for the second consecutive trading session. However, buyers cannot surpass the key resistance level at 71.00 USD yet. Brent quotes are supported by US inventory data and escalating tensions in the Middle East, fuelling concerns about possible oil supply disruptions.
Wednesday’s data showed a sharp decline in distillate and gasoline stocks to their lowest levels since early 2025 despite an increase in crude oil inventories. Gasoline stocks decreased by 527 thousand barrels, with distillate inventories down by 2.80 million barrels. At the same time, commercial crude oil reserves in the US rose by 1.75 million barrels last week.
Investors currently continue to assess the prospects for US economic growth. The Federal Reserve reiterated its forecast for two benchmark interest rate cuts this year, which supports the oil market, according to the Brent price forecast.
Brent technical analysis
Brent prices are consolidating in a descending channel, remaining under pressure from sellers. The Brent forecast for 20 March 2025 expects a breakout below the 69.65 USD support level, followed by a decline to 66.65 USD. Technical indicators confirm the bearish scenario, with the price remaining below the Moving Averages and the Stochastic Oscillator approaching the overbought area, indicating a high probability of a downward momentum. In addition, a Head and Shoulders pattern is forming on the chart, which increases the risk of a further drop in oil prices.
Summary
Brent price growth is limited by the 71.00 USD resistance level, despite support from the decline in US fuel inventories and expectations of Fed monetary policy easing. The Brent analysis for today indicates that a Head and Shoulders pattern is forming, which, combined with technical indicators, increases the likelihood of a decline to 66.65 USD.
Forecasts presented in this section only reflect the author’s private opinion and should not be considered as guidance for trading. RoboForex bears no responsibility for trading results based on trading recommendations described in these analytical reviews.


